
Fig. 7.
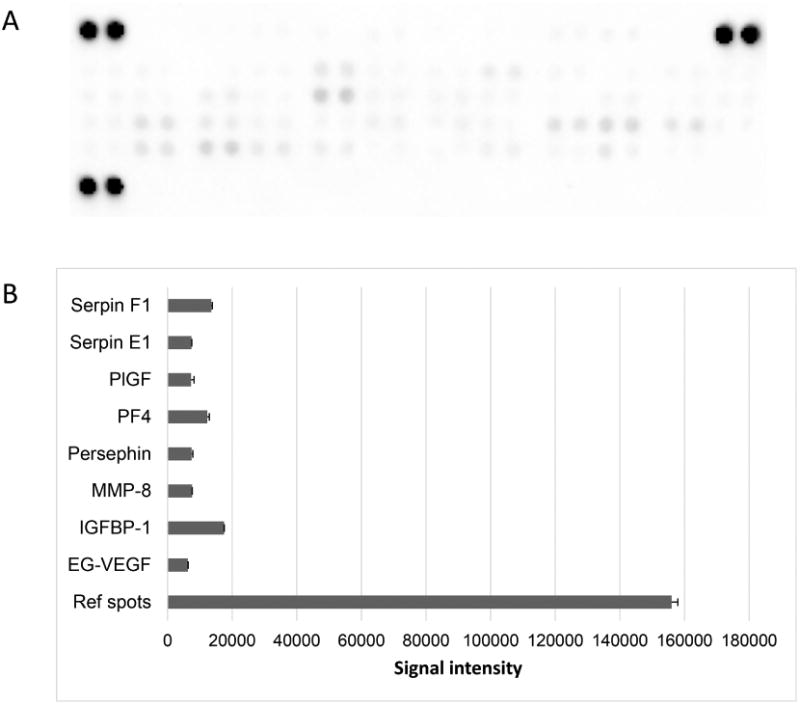
Detection of bioactive molecules in decellularizedamnion hydrogel. (A) Image of membrane from the angiogenesisarray. (B) Graph of corresponding dot integrated density values, error bars represent SD, n=2. Factors with integrated density values above 103 are shown.