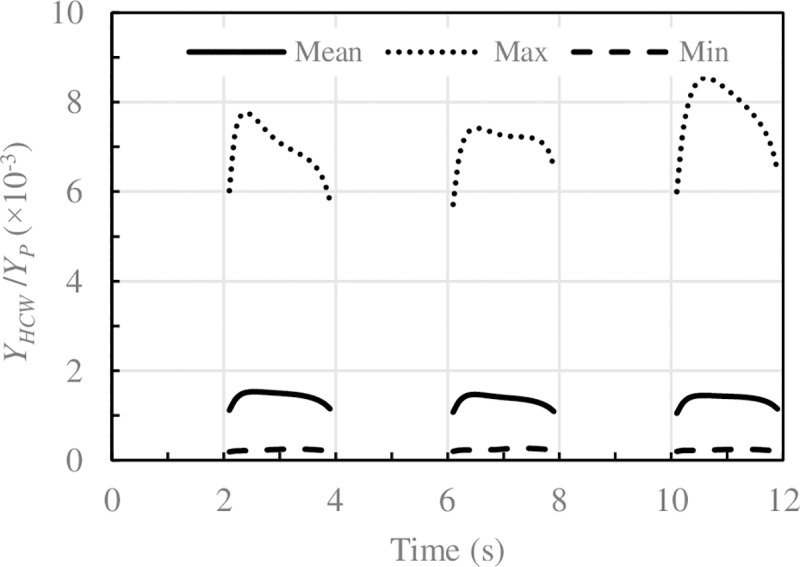
Fig 3. Concentration of N2O inhaled by the HCW for the case of EN_09.

Solid lines: phase-average values, dotted lines: maximum value, dashed lines: minimum value corresponding to 75 cycles of 12s.

Solid lines: phase-average values, dotted lines: maximum value, dashed lines: minimum value corresponding to 75 cycles of 12s.