. 2019 Jan 30;8:e36399. doi: 10.7554/eLife.36399

Figure 2. Gender bias in the first author position over time.
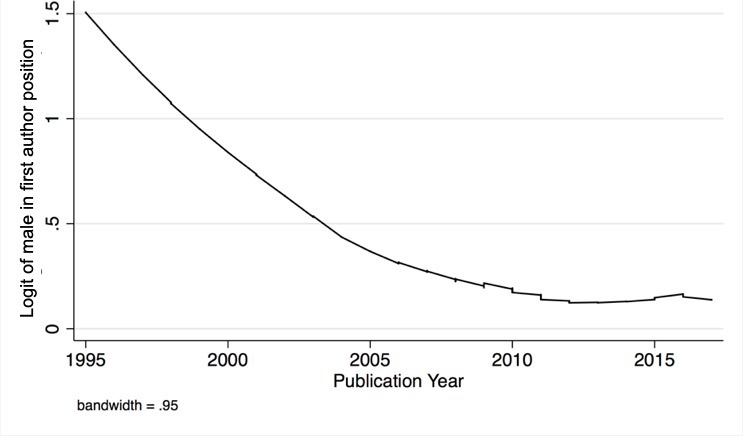
Figure 2.

Temporal trend in gender bias among two equally contributing authors of different gender: the y-axis is log (p/(1 p)) where p is the probability of bias; the x-axis is publication year. In the absence of bias, log (p/(1 p)) would be zero.

Figure 2—source data 1. Data analysis tables used for Figure 2.
DOI: 10.7554/eLife.36399.009
Figure 2—source data 2. Data analysis log.
DOI: 10.7554/eLife.36399.010
Figure 2—source data 3. Data management file for data analysis.
DOI: 10.7554/eLife.36399.011