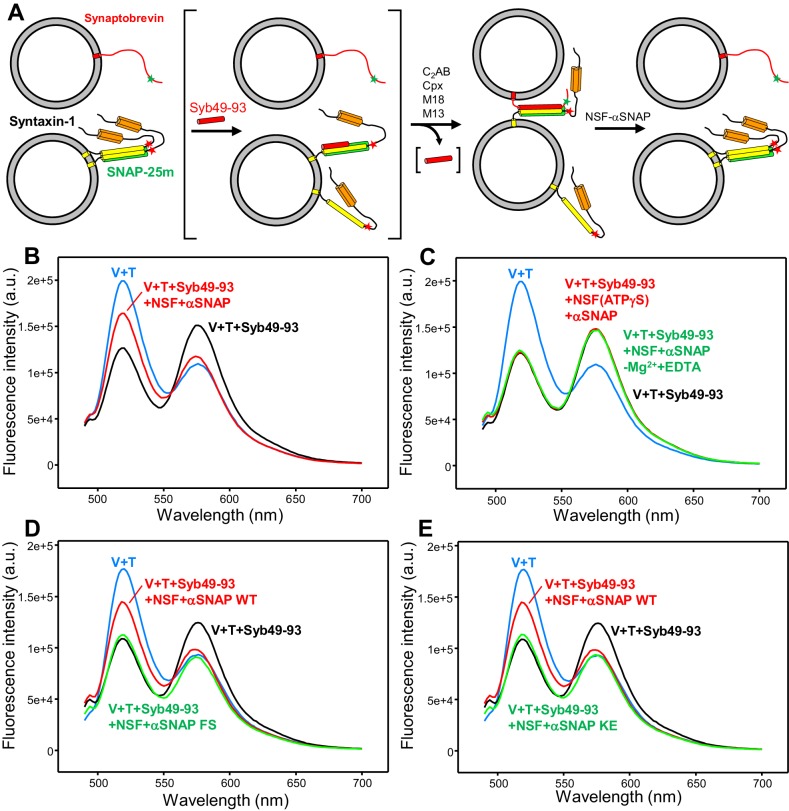
Figure 2. An assay to measure assembly of trans-SNARE complexes and disassembly by NSF-αSNAP.
(A) Diagram illustrating the assay used to monitor trans-SNARE complex assembly and disassembly. V-liposomes containing synaptobrevin labeled with a FRET donor (Alexa488, green star) at residue 26 are mixed with T-liposomes containing SNAP-25m and syntaxin-1 labeled at residue 186 with a FRET acceptor (TMR, red star) in the presence of different factors. After monitoring the decrease in donor fluorescence intensity resulting from trans-SNARE complex formation under diverse conditions, NSF and αSNAP are added to test for disassembly of trans SNARE complexes. Synaptobrevin is red, SNAP-25m green and syntaxin-1 orange (N-terminal Habc domain) and yellow (SNARE motif). Although an excess of SNAP-25m was used in preparing the syntaxin-1-SNAP-25m liposomes, the majority of syntaxin-1-SNAP-25m complexes are expected to have a 2:1 stoichiometry such that the second syntaxin-1 SNARE molecule occupies the position of the synaptobevin SNARE motif in the SNARE four-helix bundle (bottom left diagram), hindering SNARE complex formation (reviewed in Rizo and Südhof, 2012). In some of the experiments, trans-SNARE complex assembly was facilitated by inclusion of the Syb49-93 peptide, which spans the C-terminal part of the synaptobrevin SNARE motif and displaces the second syntaxin-1 molecule from the syntaxin-1-SNAP-25m heterodimer, yielding the intermediate shown between brackets. Because Syb49-93 lacks the N-terminal half of the synaptobrevin SNARE motif, it can readily be displaced by full-length synaptobrevin to form trans-SNARE complexes (Pobbati et al., 2006). In other experiments, NSF-αSNAP were added from the beginning to investigate trans-SNARE complex assembly in their presence. (B) Fluorescence emission spectra (excitation at 468 nm) of a mixture of V-liposomes containing Alexa488-synaptobrevin and T-liposomes containing TMR-syntaxin-1-SNAP-25m (1:4 V- to T-liposome ratio) that had been incubated for five hours with Syb49-93 (black trace), and of the same sample after adding NSF-αSNAP plus ATP and Mg2+ (red trace). The blue curve shows a control spectrum obtained by adding spectra acquired separately for V- and T-liposomes at the same concentrations. (C) Fluorescence emission spectra acquired under conditions similar to those of (B), with pre-incubated mixtures of Syb49-93 with V- and T-liposomes before (black curve) or after addition of NSF-αSNAP plus ATP and EDTA (green curve) or NSF-αSNAP plus ATPγS and Mg2+ (red curve). (D,E) Fluorescence emission spectra acquired under similar conditions to those of (B), except that for the green curve WT αSNAP was replaced with the αSNAP FS (D) or KE (E) mutant. The red, black and blue curves are the same as in panel (B). All spectra were corrected for dilution caused by addition of reagents.
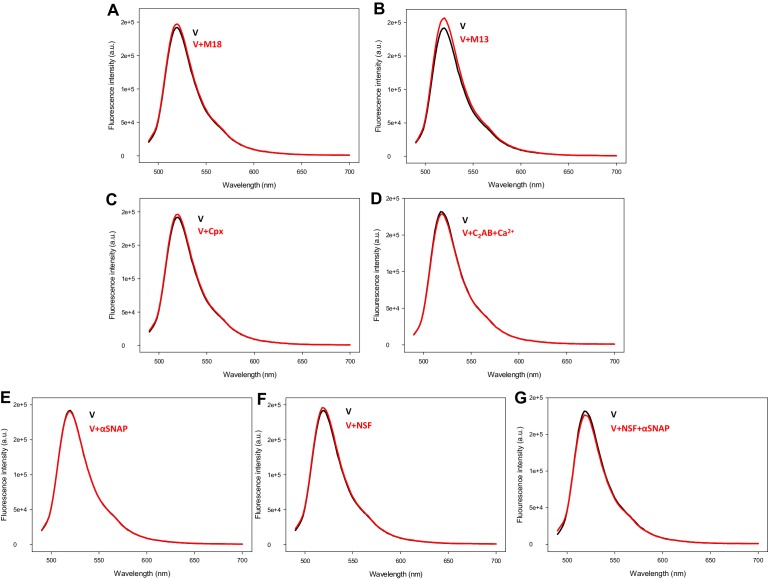
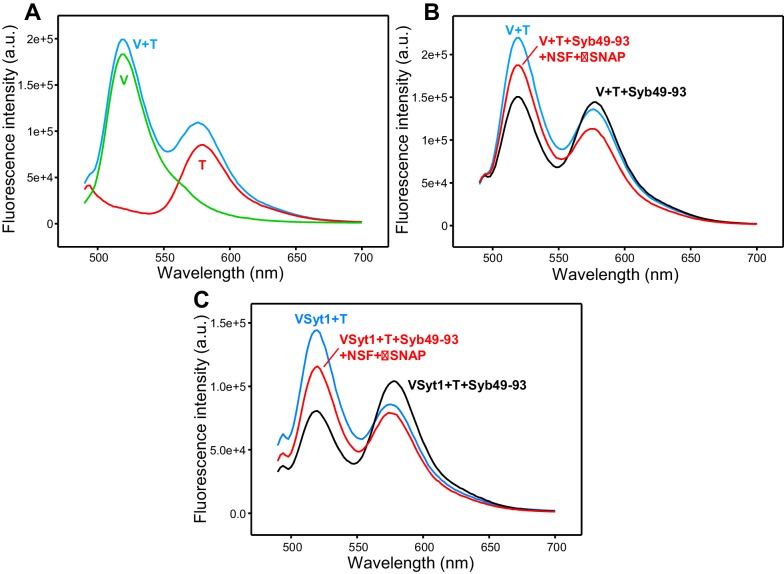
Figure 2—figure supplement 1. Control experiments acquired to assess the effects of various factors on the fluorescence emission spectra of V-liposomes containing Alexa488-synaptobrevin.
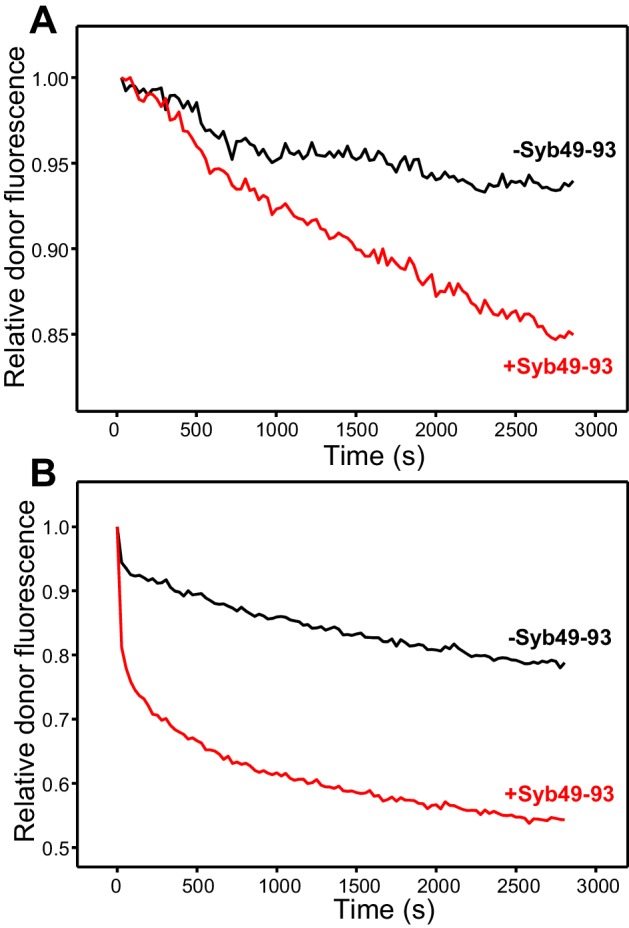
Figure 2—figure supplement 2. Syb49-93 strongly accelerates trans-SNARE complex assembly.
