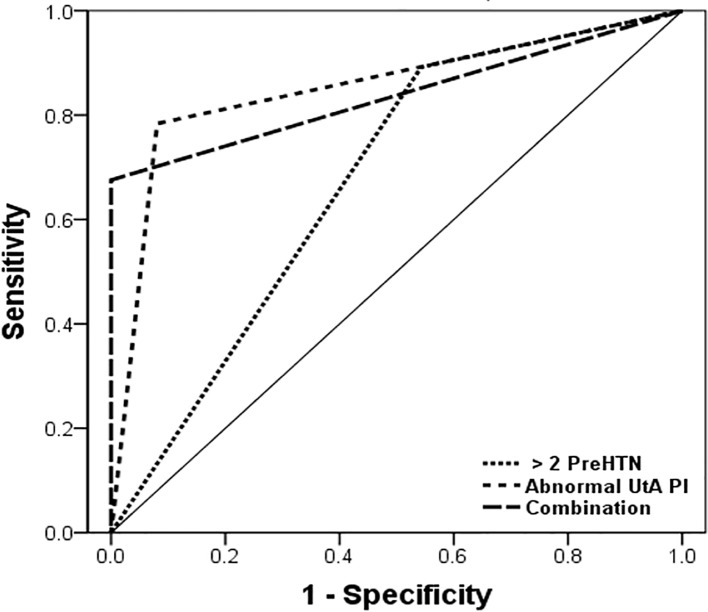
Fig 2. The receiver operating characteristic (ROC) curve of preHTN history and abnormal UtA Doppler for HDP predictions in preHTN group.
This curve had the following area under the curve (AUC) values: 0.67 for a history of preHTN, 95% confidence interval (CI) 0.59–0.75; 0.80 for abnormal UtA Doppler, 95% CI 0.77–0.93; and 0.85 for Combination, 95% CI 0.74–0.93.

