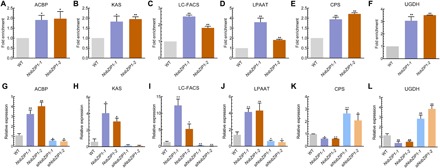
Fig. 3. ChIP-qPCR analysis.

ChIP analysis of (A) ACBP, (B) KAS, (C) LC-FACS, (D) LPAAT, (E) CPS, and (F) UGDH. Each value represents mean ± SD (n = 3). qPCR was carried out to elucidate the regulatory role of NobZIP1 in regulating transcription of predicted key target genes. (G) ACBP, (H) KAS, (I) LC-FACS, (J) LPAAT, (K) CPS, and (L) UGDH. β-Actin was used as an internal reference gene. Significant difference is indicated at P < 0.05 (*) or P < 0.01 (**) level. Each value represents mean ± SD (n = 3).
