
Fig. 2. Sweden’s 75 labor market areas.
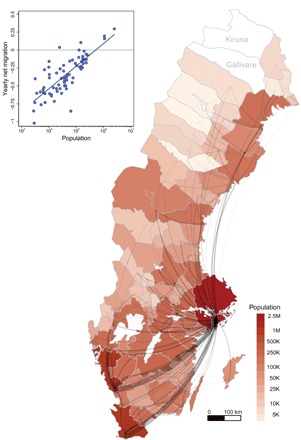
Labor market boundaries reflect commuting patterns. We colored each labor market area according to its population size (2673 to 2.51 million inhabitants). The gray ties indicate migration flows from smaller to relatively larger labor markets, weighted by the numbers of movers in 2012. In absolute terms, most movers to denser urban environments appear within the country’s largest labor market areas, reflecting their overall population size. The inset plots yearly net-migration flows (inward movers–outbound movers) during 1990–2012 as a percentage of the local working-age population against the size of labor market areas [the blue line indicates a linear best fit (slope 0.136 ± 0.023, R2 = 0.623)]. We exclude Gällivare (18,307 inhabitants) and Kiruna (22,968), the mining areas in the far north, from our individual-level analyses, as their economies depend almost exclusively on the extraction of natural resources.