
Fig. 1. Thwaites Glacier, West Antarctica.
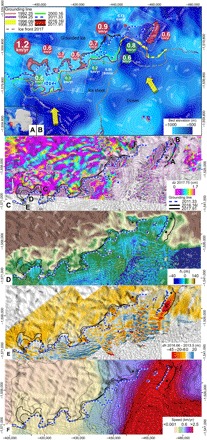
(A) Map of Antarctica with Thwaites Glacier (red box). (B) Shaded-relief bed topography (blue) with 50-m contour levels (white) (16), grounding lines color-coded from 1992 to 2017, and retreat rates for 1992–2011 (green circle) versus 2011–2017 (red circle) in kilometer per year. Thick yellow arrows indicate CDW pathways (32). White boxes indicate outline of figs. S1 and S2 (C) DInSAR data for 11 to 12 and 27 to 28 April 2016, with grounding lines in 2011, 2016, and 2017 showing vertical displacement, dz, in 17-mm increments color-coded from purple to green, yellow, red, and purple again. Points A to F are used in Fig. 2. (D) Height of the ice surface above flotation, hf, in meters. (E) Change in ice surface elevation, dh, between decimal years 2013.5 and 2016.66 color-coded from red (lowering) to blue (rising). (F) Ice surface speed in 2016–2017 color-coded from brown (low) to green, purple, and red (greater than 2.5 km/year), with contour levels of 200 m/year in dotted black.