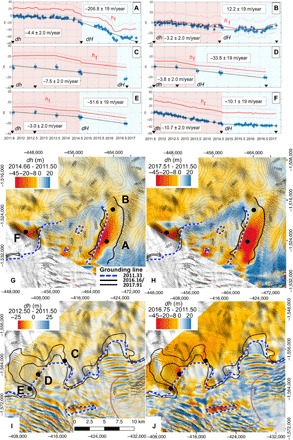
Fig. 2. Changes in ice surface elevation, h, of Thwaites Glacier.

(A to F) from TDX data (blue dots) for the time period 2011–2017 over grounded ice (red domain, dh/dt) at locations A to F, with height above floatation, hf (red lines), and 1σ uncertainty (dashed red lines), converted into change in ice thickness, H, over floating ice (blue domain, dH/dt) in meters per year. Black triangles are TDX dates in (G) to (J). (G and H) Main trunk. (I and J) TEIS. Grounding line position is thin black for 2016–2017 and white dashed blue for 2011.
