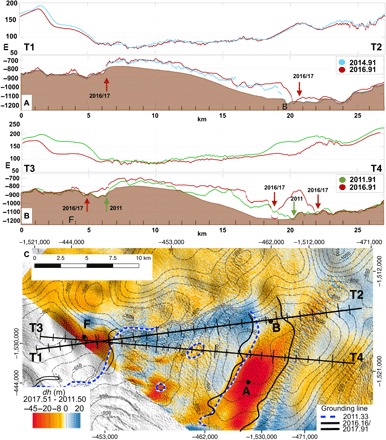
Fig. 3. Ice thickness change of Thwaites Glacier.

(A) Ice surface elevation from Airborne Topographic Mapper and ice bottom from MCoRDS radar depth sounder in 2011, 2014, and 2016, color-coded green, blue, and brown, respectively, along profiles T1-T2 and (B) T3-T4 with bed elevation (brown) from (16). Grounding line positions deduced from the MCoRDS data are marked with arrows, with the same color coding. (C) Change in TDX ice surface elevation, h, from June 2011 to 2017, with 50-m contour line in bed elevation and tick marks every 1 km.
