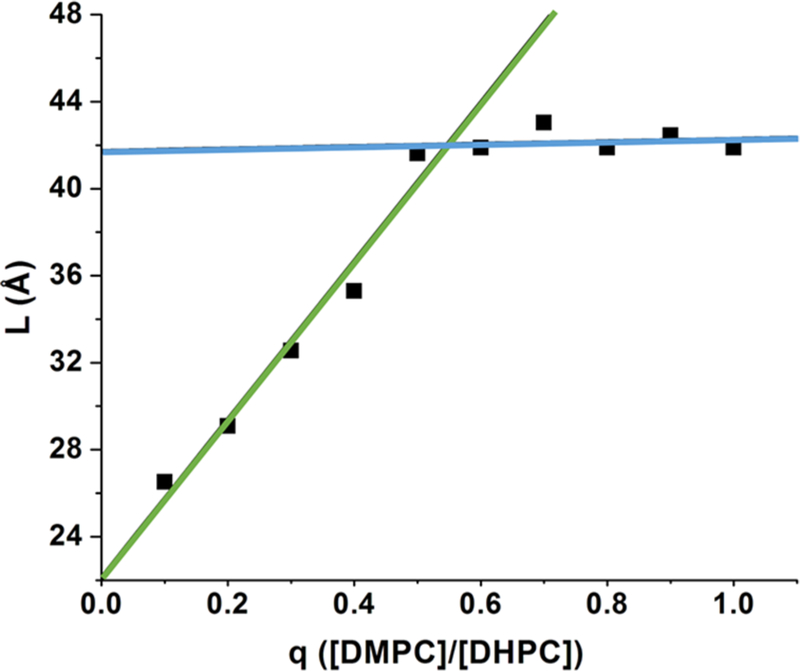
Figure 2.
Bicelle dimensions vary with q values between 0 and 0.5. The L values are measured directly from the SAXS profiles (L; L = 2π/Qmax ≈ 2 (1.5 + 1.265nc) + t, where nc is the number of carbons in the alkyl chain and t is the headgroup thickness) for bicelles with varying q (6% (w/w) amphiphile). Linear fits to the data points for q ≤ 0.5 (green) and data points for q ≥ 0.5 (blue) are shown.

