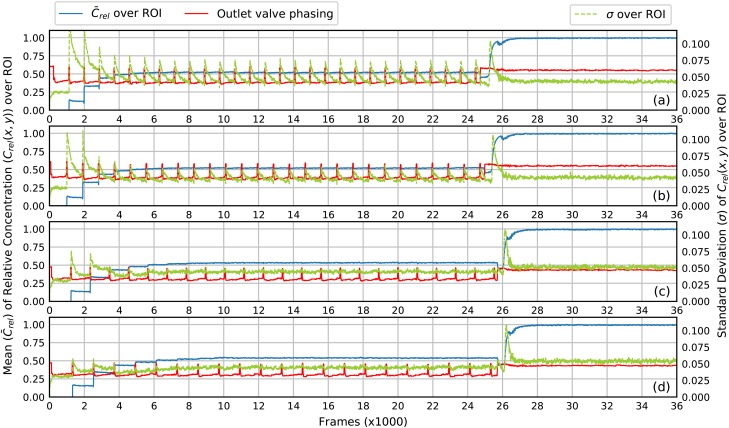
FIG. 5.
The mean and standard deviation of relative concentration in the ROI as a function of the frame number. The state (open/closed) of the outlet valve is plotted as the red curve where a pulse corresponds to open. The outlet is initially filled with Water. Near Frame 26 000 () the outlet channel is flushed with Red. (a) . (b) . (c) . (d) . See text for mixing details.

