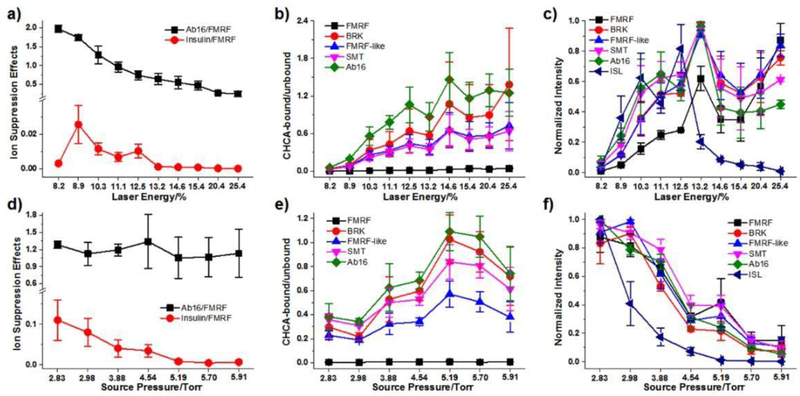
Figure 2.
Effects of laser energy and source pressure on ion suppression (a, d), matrix-binding (b, e) and intensity (c, f). All data were derived from SubAP-MALDI-Orbitrap spot analysis of peptide mixtures. Data in (c) and (f) were individually normalized to the highest peaks for each peptide throughout the tuning of laser energy and source pressure. Matrix, CHCA, 10 mg/mL. All error bars denote SD, n = 3.

