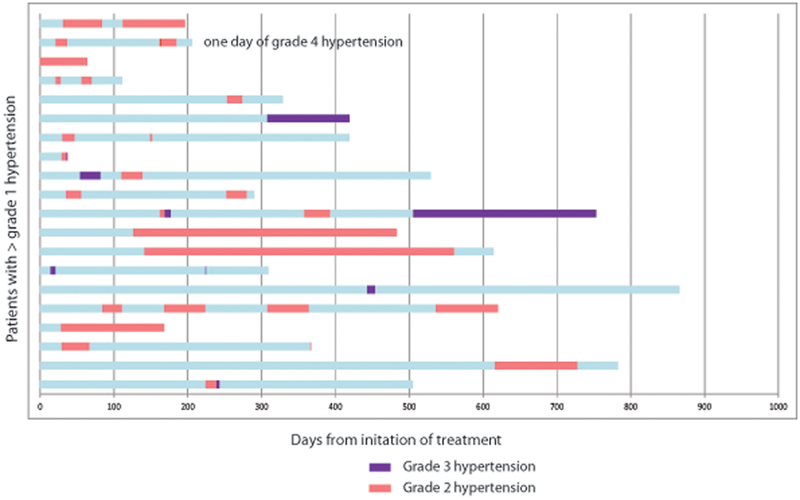
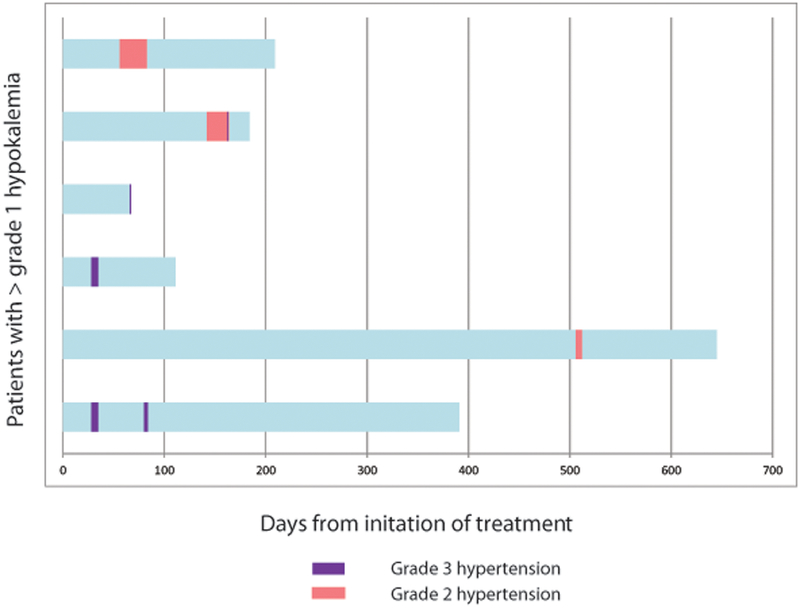
Figure 1.


Swimmer plot of timing of onset of A) hypertension or B) hypokalemia for patients developing grade >1 toxicity. Each bar on the y-axis represents an individual patient. Pink bar represents grade 2 toxicity. Purple bar represents grade 3 toxicity.
A)
B)
