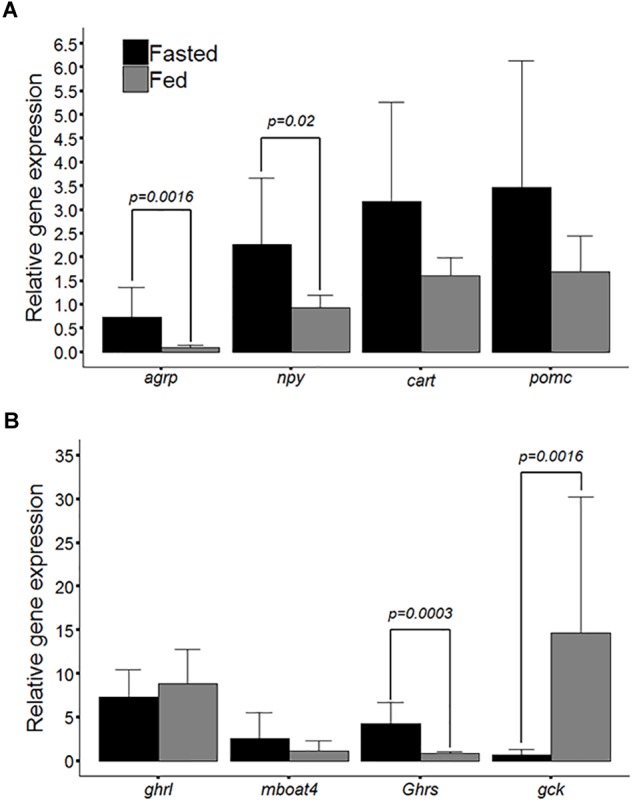
FIGURE 2.

(A) Bar plot of relative mRNA levels for the agouti-related peptide (agrp), cocaine and amphetamine-regulated transcript (cartpt), neuropeptide Y (npy) and proopiomelanocortin (pomc) between larval zebrafish groups (fasted and fed). (B) Bar plot of relative mRNA levels for ghrelin (ghrl), ghrelin O-acyltransferase (mboat4), growth hormone secretagogue receptor (ghsr) and glucokinase (gck). The values are means ± SD (n = 10), and significant differences (Mann-Whitney U-test) are denoted by P-values.
