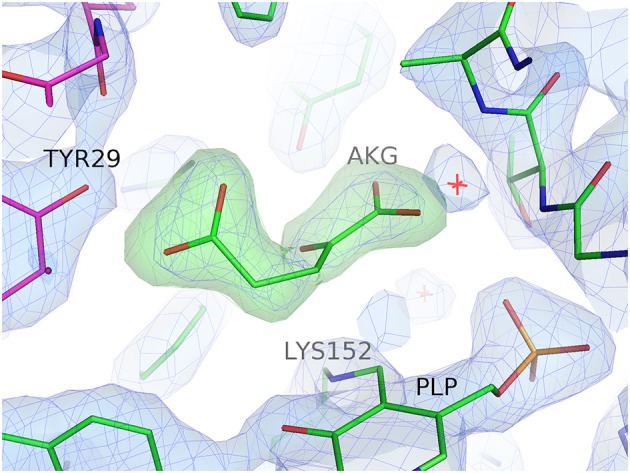
Figure 1.

Electron density for the bound substrate AKG in the active site of subunit A of the GEO1900. The 2Fo-Fc electron density map (blue) is contoured at 1.5σ, the positive (green) and negative (red) Fo-Fc electron density maps are contoured at 3.5σ and −3.5σ, respectively. Figure drawn using PyMOL (Schrödinger, LLC).
