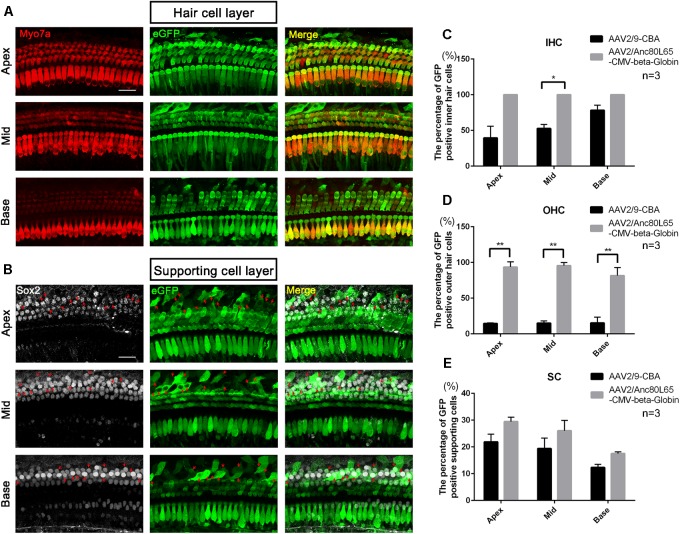
FIGURE 6.
The confocal images of AAV2/Anc80L65-CMV-beta-Globin transduction into the cochlea after in vivo injection and comparison of the in vivo transduction efficiencies in IHCs, OHCs, and SCs between AAV2/9-CBA and AAV2/Anc80L65-CMV-beta-Globin. (A) Transduction of AAV2/Anc80L65-CMV-beta-Globin in HCs of the apical, middle, and basal turns of the cochlea after in vivo injection. (B) Transduction of AAV2/Anc80L65-CMV-beta-Globin in SCs of the apical, middle, and basal turns of the cochlea after in vivo injection. The red arrows indicate the Sox2+/eGFP+ SCs. (C) Comparison of the in vivo transduction efficiencies in IHCs between AAV2/9-CBA and AAV2/Anc80L65-CMV-beta-Globin. (D) Comparison of the in vivo transduction efficiencies in OHCs between AAV2/9-CBA and AAV2/Anc80L65-CMV-beta-Globin. Overall, the in vivo transduction efficiency of AAV2/Anc80L65-CMV-beta-Globin in IHCs and OHCs was statistically significantly greater than the transduction efficiency of AAV2/9-CBA. (E) Comparison of the in vivo transduction efficiencies in SCs between AAV2/9-CBA and AAV2/Anc80L65-CMV-beta-Globin. AAV2/Anc80L65-CMV-beta-Globin induced more SCs to express eGFP than AAV2/9-CBA on average (24.33 ± 1.83% vs. 17.87 ± 1.88%, p = 0.0130). ∗p < 0.0167, ∗∗p < 0.0033, n = 3. Scale bar: 20 μm.

