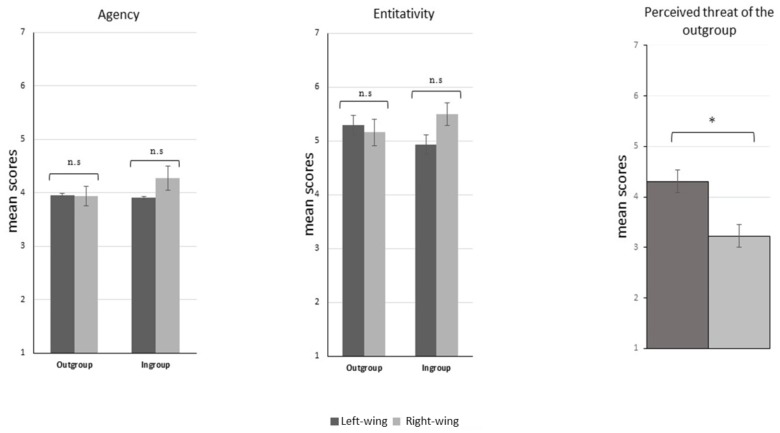
FIGURE 3.
Agentivity, Entitativity, Perceived threat. Comparisons of the mean scores between left and right-wing participants on ingroup/outgroup Agentivity, ingroup/outgroup Entitativity and Perceived threat of the outgroup. The only significant comparison between left and right-wing participants was on Perceived threat of the outgroup, with higher scores for former compared to the latter. ∗p < 0.001.

