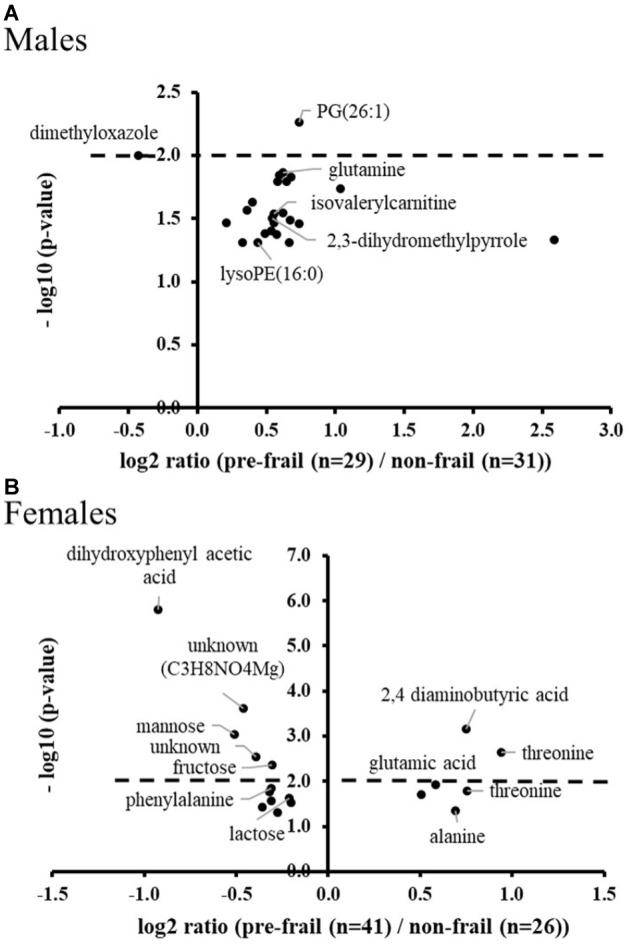
FIGURE 5.

Volcano plots of early pre-frailty markers. Significant ions at baseline in subjects (A: males and B: females) who worsened their frailty status over time (Degradation) versus stable non-frail subjects. ANOVA with country as cofactor; p-values corrected for multiple testing (Benjamini-Hochberg) < 0.05. The dot lines represent the p-value cut-off used for the logistic regression analyses (p-values < 10-2).
