FIGURE 6.

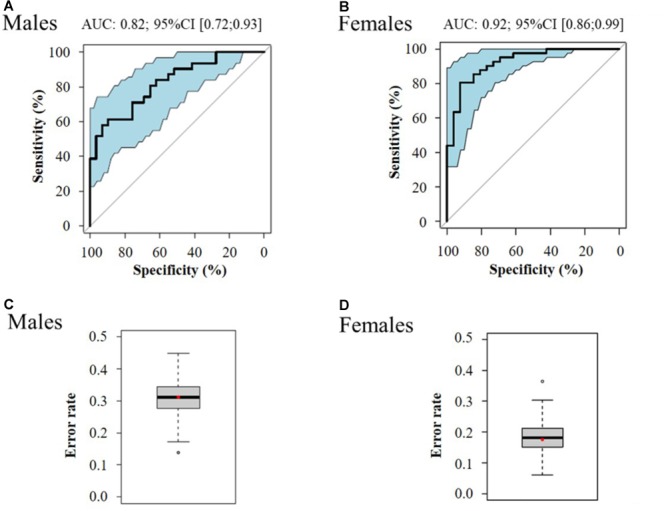
ROC curve of the best multivariate prediction models of evolution toward pre-frailty (A: males and B: females) and box-plots of the error rate corresponding to the 100 cross-validated models (C: males and D: females).

ROC curve of the best multivariate prediction models of evolution toward pre-frailty (A: males and B: females) and box-plots of the error rate corresponding to the 100 cross-validated models (C: males and D: females).