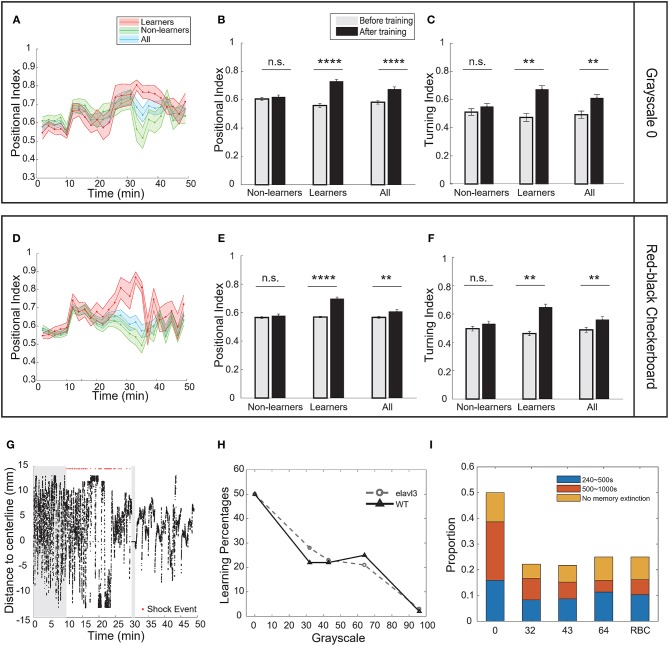
Figure 5.
Strain differences in the operant learning task. (A) Learning curves of wild-type (AB) fish. Pure-black was the conditioned pattern. (B) Analysis of the positional index of wild-type fish presented with the pure-black conditioned pattern (t-test, p < 0.0001 for learners, p = 0.5672 for non-learners, and p < 0.0001 for all fish). (C) Learners also showed significant increase in the turning index (t-test, p = 0.0082 for learners, p = 0.4561 for non-learners, and p = 0.0094 for all fish). (D) Learning curves of wild-type fish. Red-black checkerboard was the conditioned pattern. (E) Analysis of the positional index of wild-type fish presented with the red-black checkerboard conditioned pattern (t-test, learners: p = 0.0001; non-learners: p = 0.4768; all: p = 0.0082). (F) Wild-type learners also showed significant increase in the turning index (t-test, p = 0.0035 for learners, p = 0.2514 for non-learners, and p = 0.0087 for all fish). (G) A typical wild-type learner's behavioral trace. (H) Percentage of learners vs. the grayscale value of conditioned patterns for transgenic (elavl3) and wild-type fish. (I) Memory length distribution for wild-type fish. All error bars are SEM. **p < 0.01, ****p < 0.0001.

