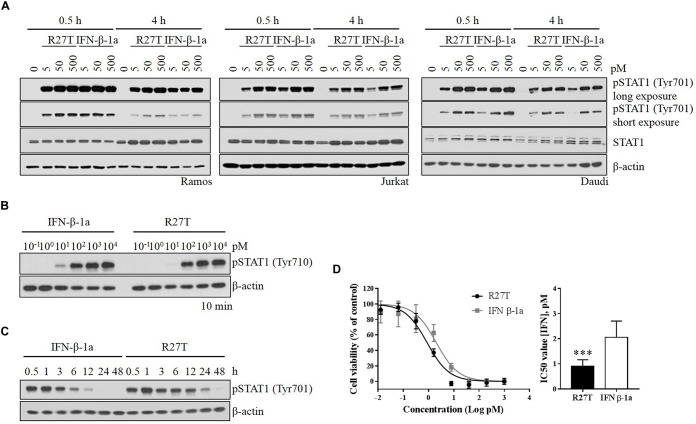
FIGURE 3.
Comparison of R27T- and IFN-β-1a-induced phosphorylation of STAT1, and inhibition of cell growth. (A) Differential dynamics of the phosphorylation of STAT1 were verified by western blot analysis, and were time- and dose-dependent for both R27T and IFN-β-1a using various cell lines. (B) Daudi cells were treated with the indicated concentrations of R27T and IFN-β-1a for 10 min. (C) Daudi cells were treated with 5 pM R27T or IFN-β-1a for the indicated time, and phosphorylation of STAT1 was analyzed by western blotting. (D) Daudi cells were treated with the indicated concentrations of R27T or IFN-β-1a. After a 72 h incubation, cell viability was determined using an EZ-Cytox cell viability kit (left panel). IC50 values, the concentration at which 50% of cell growth is inhibited compared with controls, were estimated by non-linear regression using GraphPad 7.0 (right panel). IC50 values are presented as mean ± SD of three independent experiments performed in triplicate. Statistical analysis was made using student’s unpaired two-tailed t-test (∗∗∗p < 0.001).

