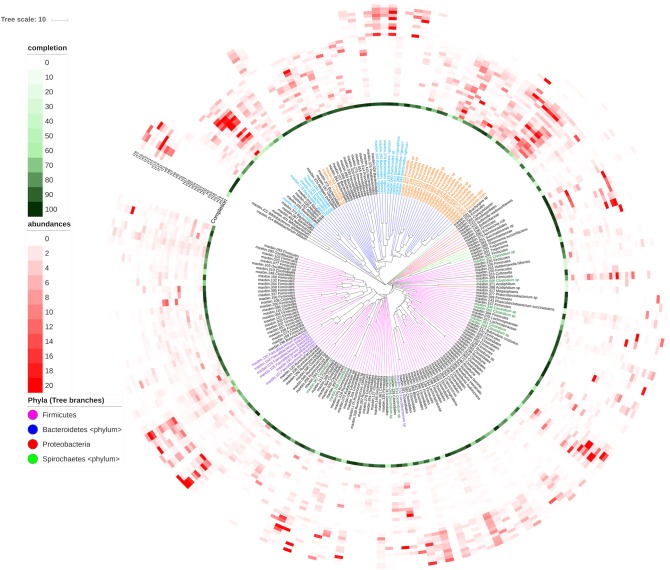
FIGURE 4.
Abundance of bins in the diverse samples. Bins were compared with the CompareM software (https://github.com/dparks1134/CompareM) to estimate their reciprocal similarities. The distances calculated between the bins were used to create a phylogenetic tree illustrating their relationships. The tree is shown in the inner part of the Figure. Branches in the tree corresponding to the four more abundant phyla in the tree (Firmicutes, Bacteriodetes, Proteobacteria, and Spirochaetes) were colored. Bins were named with their id number and original genera, and labels for the most abundant genera were also colored. Outer circles correspond to: the completeness of the bins (green-colored, most internal circle), and the abundance of each bin in each sample (red-colored). Each circle corresponds to a different sample (H, Hadza; I, Italians), and the red color intensities correspond to the bin’s abundance in the sample. The picture was prepared using the iTOL software (https://itol.embl.de).

