
FIGURE 2.
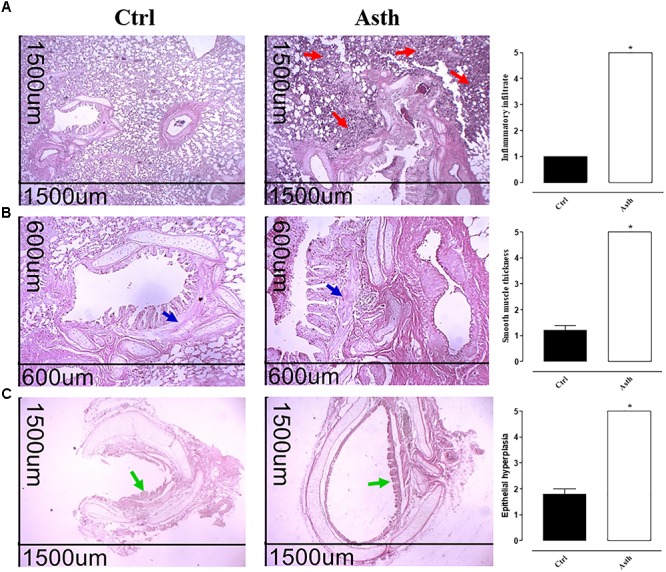
Photomicrographs of lung from guinea pigs in Ctrl and Asth groups, demonstrating infiltration of inflammatory cells in the peribronchial region and score of peribronchial cellular infiltrate (A), bronchial smooth muscle and score of muscle layer thickness (B), and bronchial epithelium and score of epithelial hypertrophy (C). Cellular infiltrate (red arrows), intrapulmonary bronchial smooth muscle (blue arrows), and bronchial epithelium (green arrows). Hematoxylin/eosin, ×40 (1500 μm) and ×100 (600 μm). The columns and vertical bars represent the mean and SEM, respectively (n = 5). Student’s t-test, ∗p < 0.05 (Ctrl vs. Asth). Ctrl: control group; Asth: chronic allergic lung inflammation group.