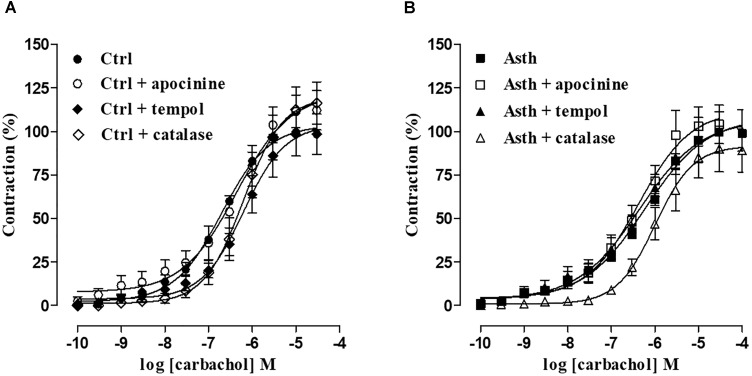
FIGURE 5.
Cumulative concentration-response curves to CCh in guinea pig trachea with epithelium in Ctrl (A) and Asth (B), in both the absence and presence of apocynin, tempol or catalase. The symbols and vertical bars represent the mean and SEM, respectively (n = 5). ANOVA one-way followed by Tukey’s post-test: ∗p < 0.05 [Ctrl E (+) vs. Asth E (+)]. Ctrl: control group; Asth: chronic allergic lung inflammation group; E (+): epithelium present.

