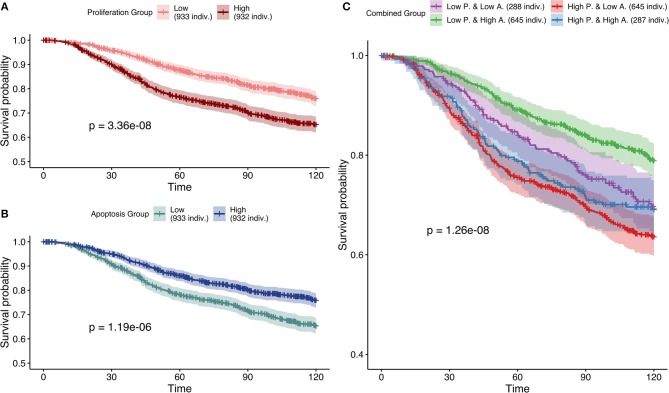
Figure 10.
Survival analyses of METABRIC samples from which exome mutations are used as Strict Node Variants and RNA as Soft Node Variants in the model (case 5). All p-values are derived from a log-rank test. (A) Survival curves with high and low Proliferation groups. (B) Survival curves with high and low Apoptosis groups. (C) Survival curves with combined groups.

