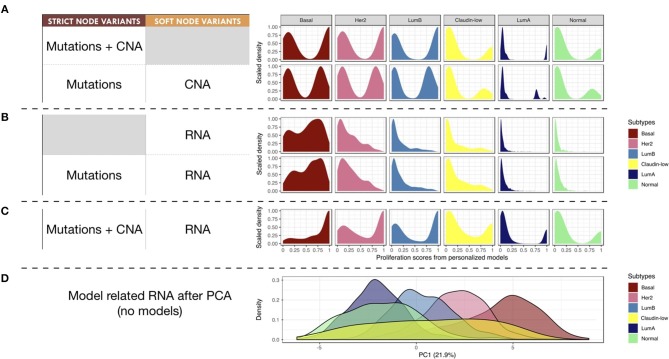
Figure 8.
Breast-cancer subtypes and personalized logical models. (A–C) Patterns of Proliferation probabilities per subtype with different personalization methods results in different grouping of subtypes. (D) Densities of breast-cancer subtypes along first principal component, PCA transformation based on METABRIC RNA data limited to the 114 genes described in the logical model ; percentage of variance explained by PC1 in parenthesis.

