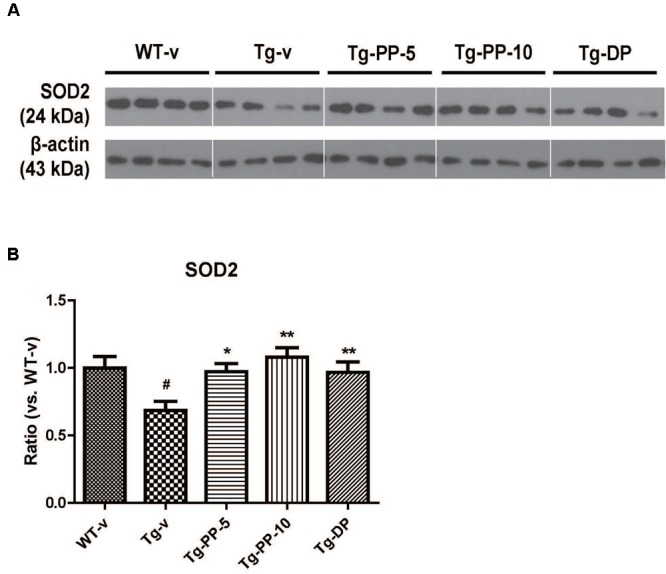
FIGURE 5.

PSM-04 increased the expression of SOD-2 in the brain of 5xFAD mice. Representative Western blot demonstrating protein expression levels of SOD-2 in the hippocampus of each group. (A) Representative blot showing that SOD-2 protein levels increased in the hippocampal tissue lysates of PSM-04-treated Tg mice compared with those of the non-treated Tg mice. (B) The relative SOD-2 protein levels were shown as a ratio versus to the control (Tg-v). The statistical analyses were performed by one-way ANOVA, and data are presented as the means ± SEM. #p < 0.05 vs. WT-v. ∗p < 0.01 and ∗∗p < 0.01 vs. Tg-v. WT-v (n = 8); WT-PP-5 (n = 9); Tg-v (n = 7); Tg-PP-5 (n = 6); Tg-PP-10 (n = 6); Tg-DP (n = 5).
