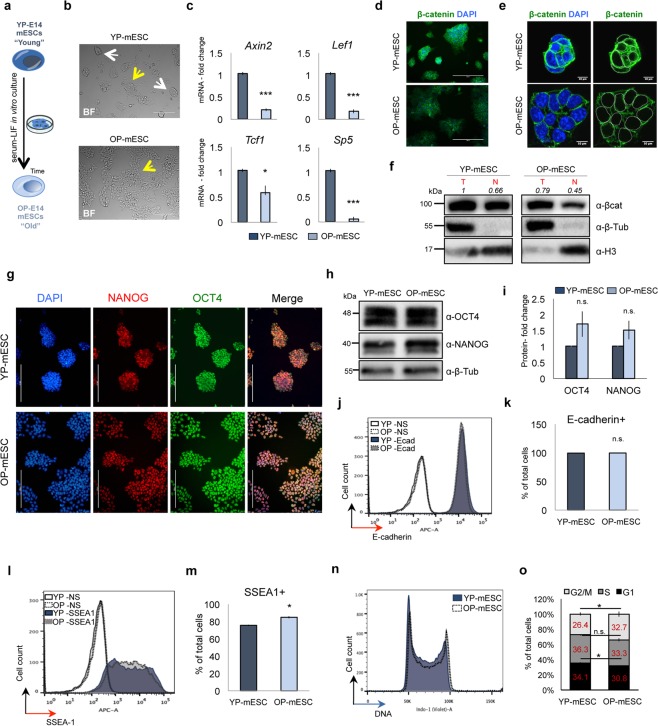
Figure 1.
Prolonged in vitro cell culture of E14 mouse embryonic stem cells (mESCs) correlates with low Wnt/β-catenin activity. (a) Schematic representation of Young (YP) and Old passage (OP) E14 mESCs. (b) Representative bright field images of YP- and OP-mESCs. Round-shaped and flat colonies are indicated by white and yellow arrow, respectively. (c) Quantitative real-time PCR showing the expression profiles of Axin2, Lef1, Tcf1, Sp5 in YP- and OP- mESCs. The transcriptional levels are normalized to Gapdh as reference gene. Data are represented as fold change (2−ΔΔCt) relative to the YP-E14 mESCs and means of n = 3 independent experiments ± SE. (d,e) Representative immunofluorescence (d) and confocal microphotographs (e) of β-catenin. Nuclear demarcation is indicated by white circles (right panel). (f) Western blot analysis showing total and nuclear β-catenin protein in YP- and OP-mESCs and its quantification (n = 1) relative to total β-catenin in YP-mESCs. For quantification, densitometric analysis was performed with ImageJ software. The quantification reflects the relative amounts as a ratio of each protein band relative to their loading control. (g) Representative immunofluorescence images showing OCT4 (green), NANOG (red) and their merge in YP- and OP-E14 mESCs. (h,i) Representative western blot analysis of OCT4 and NANOG in YP- and OP-mESCs (h) and its quantification represented as fold change over the protein amount in YP-mESCs and means of n = 3 independent experiments ± SE (i). (f,h,i) Full scan blots are available in Supplementary Fig. 6. (j–m) FACS-plot showing the percentage of E-cadherin +(j) and SSEA1 +cells (l) in YP- and OP- mESCs and its quantification (k,m) as means of 3 technical replicates ± SE (NS: non stained). (n,o) Representative cell cycle FACS profile analyzed with Flowjo software (n) and its quantification (o) represented as percentage of total cells and means of n = 3 independent experiments ± SE. Scale bar is 200 (b,d,g) and 10 μm (e). (d,e left panel, and g) Nuclei were stained with DAPI. (f,h) β-tubulin and H3 were used as loading controls. (c,i,k,m,o) Asterisks indicate statistical significance calculated by unpaired two-tailed t test analysis (n.s. not significant; *p-value < 0.05; ***p-value < 0.001).

