Figure 2.
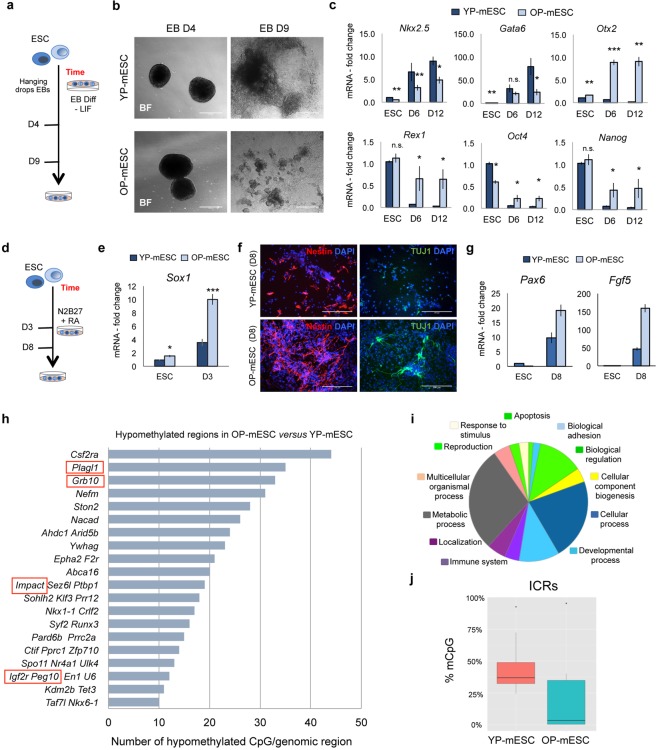
Old passage E14 mESCs show differentiation defects and loss of methylation at ICRs. (a) Schematic representation of embryoid body (EB) differentiation protocol of YP- and OP- mESCs. (b) Representative bright field images showing EBs at day 4 (D4) and 9 (D9) obtained from both YP- and OP- E14 mESCs. Scale bar is 400 μm. (c) Quantitative real-time PCR showing the expression profiles of differentiation genes (Nkx2.5, Gata6, Otx2) and pluripotency genes (Rex1, Oct4, Nanog) in YP- and OP- E14 mESCs (ESC) and during EB differentiation at day 6 (D6) and day 12 (D12). (d) Schematic representation of neural differentiation protocol of YP- and OP- mESCs. (e) Quantitative real-time PCR showing the expression profiles of Sox1 at day 3 (D3) of N2B27 + retinoic acid (RA) treatment in YP- and OP-E14 mESCs (ESC). (f) Representative immunofluorescence images showing Nestin (left panels) and III β-tubulin (TUJ1, right panels) protein expression in YP- and OP- mESCs at day 8 (D8) of neural differentiation. (g) Quantitative real-time PCR experiment showing the expression profiles of Pax6 and Fgf5 at day 8 (D8) of N2B27 + retinoic acid (RA) treatment in YP- and OP- E14 mESCs (ESC). (c,e,g) The transcriptional levels are normalized to Gapdh as a reference gene. Data are represented as fold change (2−ΔΔCt) relative to the YP-E14 mESCs and the results are means of n = 3 independent experiments ± SE (c,e) and means of n = 3 technical replicated for SD (g). (c,e) Asterisks indicate statistical significance calculated by unpaired two-tailed t test analysis (n.s. not significant; *p < 0.05; **p < 0.01; ***p-value < 0.001). (h) Number of hypomethylated common CpGs in OP- versus YP- E14 mESCs analyzed by RRBS covered by at least 10 reads and showed at least 25% of methylation reduction. Red rectangle indicates imprinted regions. (i) Gene ontology of hypomethylated regions in OP-E14 mESCs analyzed by PANTHER (www.pantherdb.org). (j) Box-plot, from min–max values, showing the distribution of mCpG levels at ICRs in YP- and OP-E14 mESCs determined by RRBS analysis. The plots indicate the first quartile, median (black line) and third quartile. Data are obtained from the average of n = 2 biological replicates.

