Figure 3.
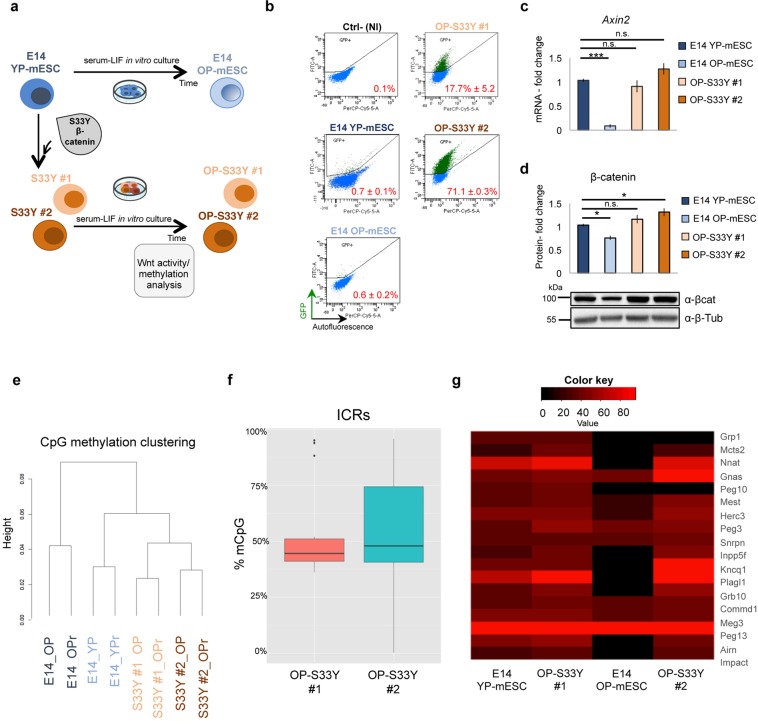
β-catenin overexpressing mESC clones maintain high Wnt/β-catenin activity and normal ICR methylation level after several in vitro passages. (a) Scheme showing how β-catenin overexpressing mESC clones (S33Y #1, #2) were obtained and grown. (b) Representative FACS-plot showing the percentage of positive mESCs for 7TGP topflash reporter activity in YP-mESCs, OP-mESCs, OP-S33Y #1 and OP-S33Y #2 mESC clones. The non infected (NI) cells were used as negative control (Ctrl-). The FITC and the Per-CP-Cy5.5-A detectors were used to identify GFP +(y axis) and autofluorescence (false positive) cells (x axis). The number of recorded events spans from 12000 (OP-mESC) to 18000 (YP-mESCs). Data are represented as means of n = 3 independent experiments ± SD. (c) Quantitative real-time PCR experiments showing the expression profiles of Axin2 in YP-mESCs, OP-mESCs, OP-S33Y #1 and OP-S33Y #2 mESC clones. The transcriptional levels are normalized to Gapdh as a reference gene. Data are represented as fold change (2−ΔΔCt) relative to the YP-E14 mESCs and the results are means of n = 3 independent experiments ± SE. Asterisks indicate statistical significance calculated by unpaired two-tailed t test analysis (n.s. not significant; ***p < 0.001). (d) Western blot analysis showing total β-catenin protein levels in E14 YP-mESCs, OP-mESCs, OP-S33Y #1 and OP-S33Y #2 mESC clones and its quantification. Data are represented as fold change over the protein amount in YP-mESCs and means of n = 3 independent experiments ± SE. β-tubulin was used as loading control. For western-blot quantification densitometric analysis was carried out by using ImageJ software. The quantification reflects the relative amounts as a ratio of each protein band relative to their loading control. (e) Cluster analysis of the four different mESCs. For each line 2 different biological replicates were represented. (f) Box-plot, from min–max values, showing the distribution of mCpG levels at ICRs in OP-S33Y #1 and OP-S33Y #2 mESC clones determined by RRBS analysis. The plots indicate the first quartile, median (black line) and third quartile. Data are obtained from the average of n = 2 biological replicates. (g) Heat-map representation of ICR methylation levels in YP-mESCs, OP-mESCs, OP-S33Y #1 and OP-S33Y #2 mESC clones.

