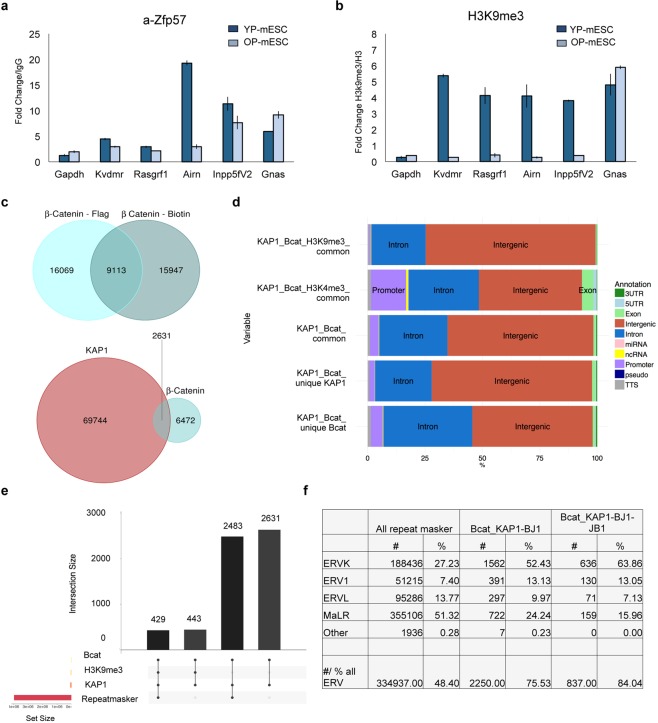
Figure 4.
β-catenin and KAP1 share intergenic common DNA binding sites localized mainly on LTRs and ERVs. (a,b) Representative ChIP-qPCR experiment (out of n = 2 independent experiments) of ZFP57 (a) and H3K9me3 (b) recruitment at several ICRs. The data are represented as fold change (2−ΔΔCt) over IgG (a) or H3 (b) and means ± SD. (c) Venn diagram showing overlapping regions between ChIP-sequencing profiles of β-catenin and KAP1. The peaks between Flag- (β-catenin-Flag) and Biotin- (β-catenin-Biotin) tagged endogenous β-catenin published by Zhang and colleagues73 were intersected among them. The common bound regions were then overlapped with KAP1 ChIP-sequencing peaks performed in BJ1 mESCs by Anvar and colleagues31. (d) Bar chart showing genomic distribution of unique and common peaks among β-catenin, KAP1, H3K9me3, H3K4me3. (e) Bar chart showing ChIP-sequencing peaks intersection among KAP1, β-catenin, KAP1, H3K9me3 and Repeat masker. The number of common overlapping peaks is indicated on the top of the bars. (f) Table showing the different LTR and ERV families represented as number (#) and percentage (%) over Repeat maskers (column 2, 3), the total number of common overlapping peaks between β-catenin and KAP1 in BJ1 (column 4, 5), the total number of common overlapping peaks among β-catenin, KAP1 in BJ1 and KAP1 in JB1 mESCs (columns 6, 7).

