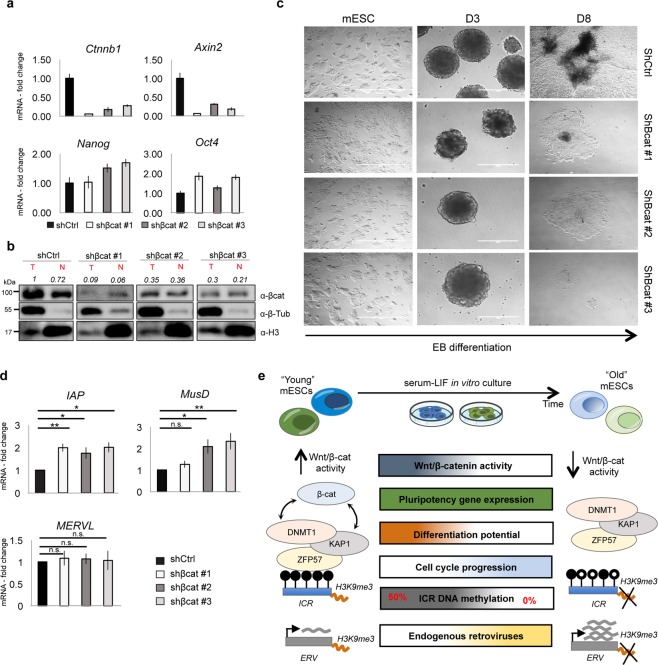
Figure 6.
β-catenin silencing impairs mESC differentiation. (a) Quantitative real-time PCR analysis showing β-catenin silencing efficiency, Axin2 and pluripotency marker (Nanog, Oct4) levels. The transcriptional levels are normalized to Gapdh as a reference gene. Data are represented as fold change (2−ΔΔCt) relative to the shCtrl-infected mESCs and the results are means of n = 3 technical replicated ± SD. (b) Western blot analysis showing protein levels of total and nuclear β-catenin in shCtrl-, shβcat#1-, shβcat#2- and shβcat#3- transduced E14 mESCs (n = 1). Quantification of total and nuclear β-catenin is represented as relative to total β-catenin in shCtrl-transduced mESCs. β-tubulin and H3 were used as loading controls. For western-blot quantification densitometric analysis was carried out by using ImageJ software. The quantification reflects the relative amounts as a ratio of each protein band relative to their loading control. (c) Representative bright field images of mESCs and embryoid bodies (EBs) at day 3 (D3), 8 (D8) after β-catenin silencing (shβcat #1, #2, #3) versus the control condition (shCtrl). Scale bar is 400 μm. (d) Quantitative real-time PCR experiments showing the expression profiles of ERVs (IAP, MusD, MERVL) in shCtrl-, shβcat#1-, shβcat#2- and shβcat#3- transduced E14 mESCs. The transcriptional levels are normalized to Gapdh as a reference gene. Data are represented as fold change (2−ΔΔCt) relative to shCtrl-infected mESCs and are means of n = 3 independent experiments ± SE. Asterisks indicate statistical significance calculated by unpaired two-tailed t test analysis (n.s. not significant; *p < 0.05; **p < 0.01). (e) Schematic representation showing cellular and epigenetic changes occurring in prolonged in vitro mESC cultures along with Wnt/β-catenin pathway downregulation.

