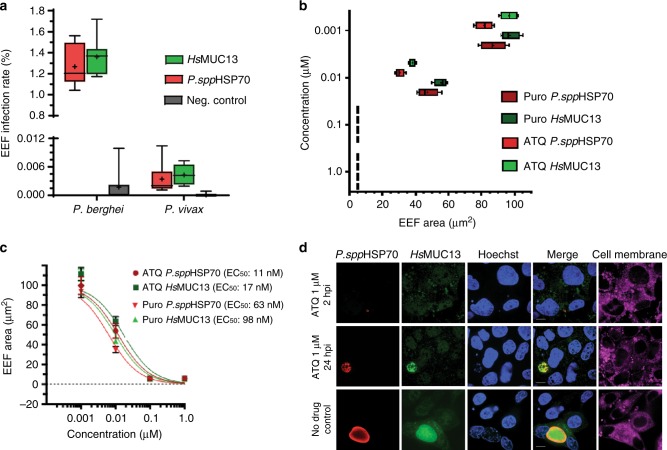
Fig. 4.
MUC13 as a quantitative biomarker of Plasmodium EEF infection. a Counts of P. berghei or P. vivax EEF in HC04 cells by indirect immunofluorescence. Negative controls with no primary antibodies were included. Parasite burden was estimated by counting at least 240,000 cells, via high content imaging. Data (n = 3) presented with the mean indicated by a “+” and error bars indicating the 5–95% confidence interval. b Effect of atovaquone (ATQ) and puromycin (PURO) treatment (2 hpi) on cell area (growth) of P. berghei EEF in HC04 at 48 hpi. Data (n = 4) presented with the mean indicated by a “+” and error bars indicating the 5–95% confidence interval. c Dose–response curves of P. berghei EEF in HC04 cells for atovaquone (ATQ) and puromycin (PURO). 95% confidence interval for EC50s = ATQ P. spp HSP70, 8.98–15.82; ATQ HsMUC13, 11.18–26.05; PURO HsMUC13, 6.29–15.29; PURO P. spp HSP70, 5.01–7.92. Data presented as mean ± SD, n = 2 with 5–95% confidence intervals indicated. d Representative images of P. berghei EEF in HC04 cells (48 hpi) treated (2 hpi) with 1 μM of atovaquone, puromycin, or DMSO. P. berghei was labeled with P. ssp HSP70 mouse polyclonal antibody (dilution 1:500, 1 mg/ml stock). HC04 cells were labeled with a rabbit polyclonal antibody (dilution 1:500, 1 mg/ml stock) recognizing the intracellular region of HsMUC13 (MUC13 antibody #2—LifeSpan BioSciences #LS-C345092). Primary antibody detection was performed with goat anti-mouse (Alexa Fluor 647, red) and goat anti-rabbit (Alexa Fluor 488, green) antibodies. Nuclei and cell membranes were stained with Hoechst 33342 (blue) and CellMask deep red (magenta), respectively. Scale bar 10 μm; 100× oil

