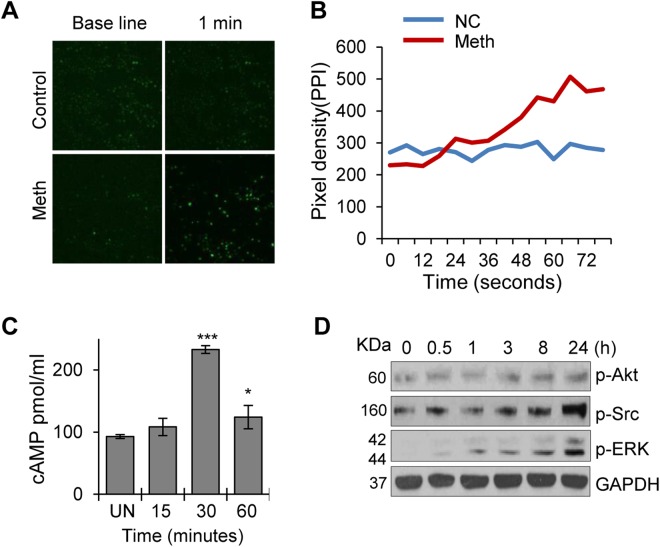
Figure 2.
Meth enhances intracellular calcium and cAMP levels in CD4+ T-cells. (A) Calcium influx was measured by staining the CD4+ T-cells with Fluo-4,AM, followed by addition of 100 µM Meth and live cell imaging by confocal microscopy. (B) Pixel densities of images in (A) were determined by ImageJ and plotted against time (seconds). Data represent the mean ± SEM of 3 independent experiments for untreated cells vs. cells treated with Meth. (C) cAMP levels were analyzed by ELISA after treating CD4+ T-cells with 100 µM Meth and acquiring samples at different time points (0, 15 min, 30 min and 1 hour). Data represent the mean ± SD of 3 independent experiments (*p ≤ 0.05, ***p ≤ 0.001). (D) CD4+ T-cells were untreated or treated with 100 µM Meth for the indicated time points (0.5–24 hours), lysed, and protein extracts were analyzed by Western blotting for the signaling molecules p-Akt, p-Src and p-ERK. GAPDH was used as a loading control. Full-length blots are presented in Supplementary Fig. S1.

