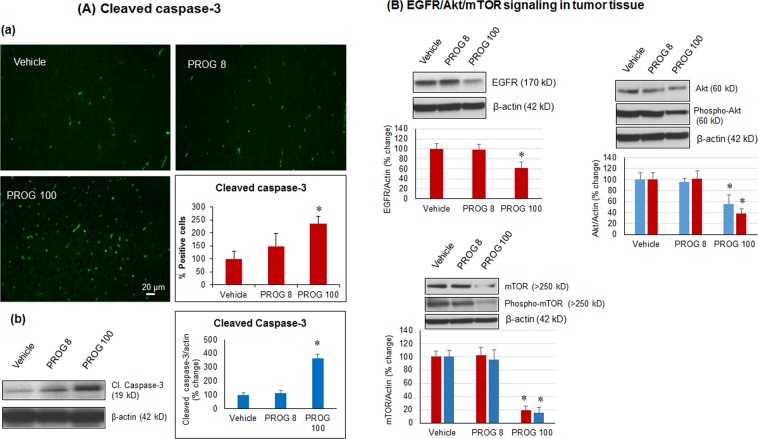
Figure 3.
In vivo effect of progesterone on markers of (A) apoptosis and (B) PI3K/Akt/mTOR signaling in tumor tissue. Representative photomicrographs of IHC and cell counting (a) and representative western blot bands with densitometric analysis (b) from different groups. Values are expressed as mean ± SD in different groups (n = 8 each). Significant difference: *P < 0.01 compared to control. Bands were cropped from different parts of the same gel, or from different gels (Supplementary Figure S2).

