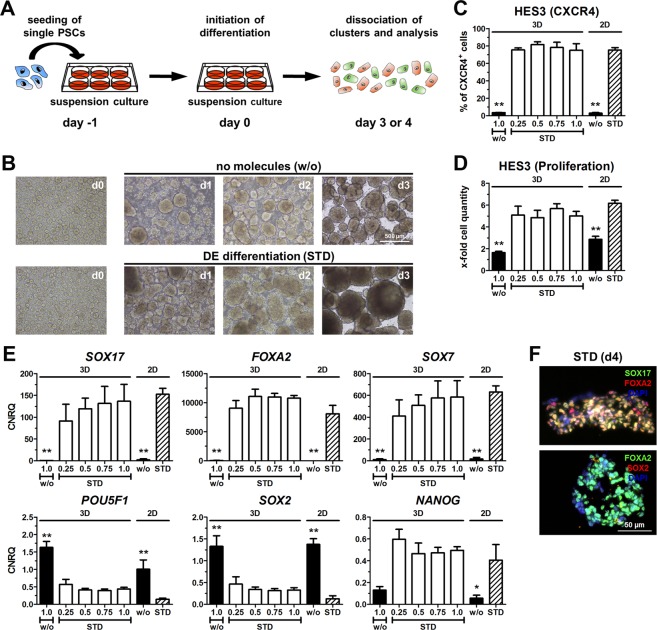
Figure 2.
Differentiation towards DE in 2D and 3D. (A) Experimental setup for differentiation in 3D culture. (B) Representative light microscopic images of HES3 cell clusters in 3D suspension culture at different days during randomized (w/o) or standard (STD) differentiation. Scale bar: 500 µm. (C–E) Differentiation of HES3 in 3D or 2D under randomized conditions (w/o, inoculum of 1.0 × 10⁶ cells) or under standard conditions (STD, inoculum 0.25 to 1.0 × 10⁶ cells) using 5 µM CHIR. Values are means ± SEM, n = 4–8. Statistical analysis was performed with ANOVA plus Dunnett’s post hoc test, *p < 0.05, **p < 0.01 compared to the STD-2D condition (striped column). (C) Quantification of CXCR4+ cells by flow cytometry. (D) Cell proliferation in relation to inoculated cell number. (E) Normalized expression of marker genes for DE (SOX17, FOXA2), extra-embryonic endoderm (SOX7) and pluripotency (NANOG, POU5F1, SOX2) scaled to undifferentiated cells (CNRQ = calibrated normalized quantities). (F) Representative fluorescence micrographs of HES3 at day 4 of STD-3D differentiation. Depicted are SOX17 (green) and FOXA2 (red) in the upper image and FOXA2 (green) and SOX2 (red) in the lower image. Nuclei were counterstained with DAPI (blue). Scale bar: 50 µm.

