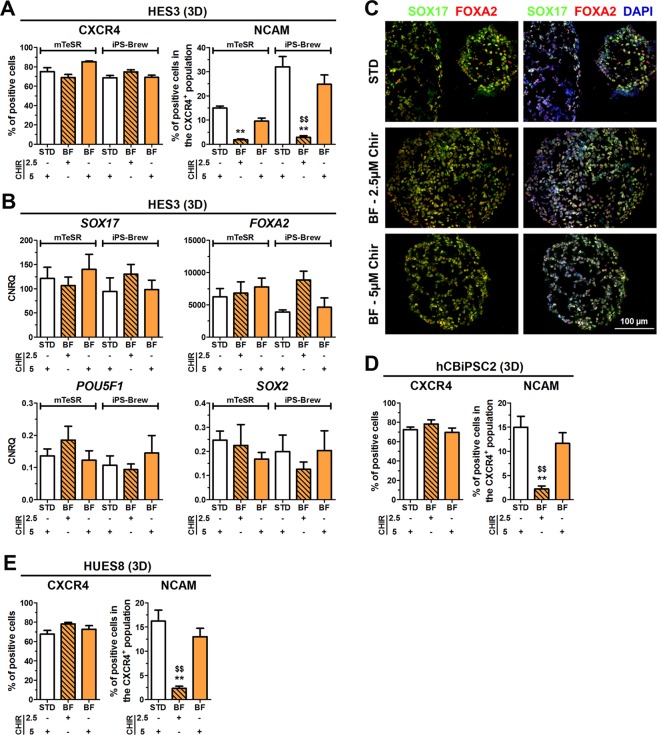
Figure 5.
BSA-free (BF) differentiation towards DE in 3D. HES3, HUES8 or hCBiPSC2, maintained in mTeSR or iPS-Brew were differentiated under standard (STD) or BSA-free (BF) conditions using 2.5 or 5 µM CHIR in 3D. (A) Quantification of CXCR4+ (left) and NCAM+/CXCR4+ double-positive cells (right) by flow cytometry at day 3/4 upon DE differentiation of HES3. Values are means ± SEM, n = 6–10. Statistical analysis was performed with ANOVA plus Bonferroni’s post hoc test, **p < 0.01 compared with STD and $$p < 0.01 comparing 2.5 µM vs 5 µM CHIR using BF conditions. (B) Normalized expression of SOX17, FOXA2, POU5F1 and SOX2 upon differentiation of HES3. All values were scaled to undifferentiated cells and represent means ± SEM, n = 6–10. (C) Representative fluorescence micrographs of cryosections from cell clusters (HES3) at day 4. Depicted are SOX17 (green) and FOXA2 (red). Nuclei were counterstained with DAPI (blue, right panel). Scale bar: 100 µm. (D,E) Quantification of CXCR4+ cells and of CXCR4+/NCAM+ cells upon 3D differentiation using hCBiPSC2 (D) or HUES8 (E) cells. Values are means ± SEM, n = 6–10. **p < 0.01 compared with STD and $$p < 0.01 comparing 2.5 µM vs 5 µM CHIR using BF conditions. See also Fig. S3.

