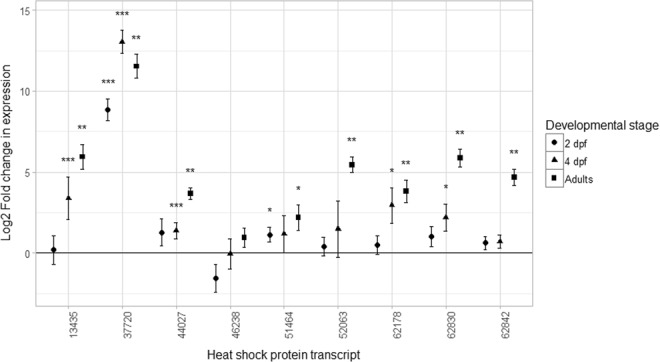
Figure 2.

Differential gene expression between heat shock and control conditions for nine HSP transcripts in day 2 larvae (n = 3), day 4 larvae (n = 3) and adult P. miliaris sea urchins (n = 5). Data are shown as log2-transformed fold changes (i.e. −ΔΔCt) ± S.E., calculated according to the 2−ΔΔCt method69. Raw Cts (threshold cycles) used in the calculations were first efficiency corrected as follows: Ct ∗ log2(E) = E-corrected Ct (where E: amplification efficiency). Asterisks above individual fold change values indicate significantly different expression between heat shock and control treatments (randomisation test performed with REST 2009): *p < 0.05; **p < 0.01; ***p < 0.001. dpf: days post fertilisation.
