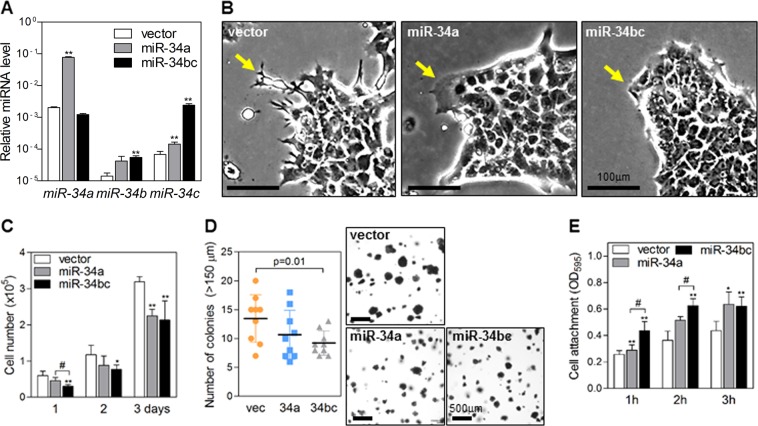
Fig. 3. miR-34b/c enhances the anchorage- and attachment-dependence of lung cancer cells.
a qRT-PCR of miR-34 family members in 344SQ cells transduced with miR-34a, miR-34b/c, or empty vectors. The expression levels were normalized to the RNU6B snoRNA level. Data are expressed as the mean ± SD (n = 3). **P ≤ 0.01; two-tailed Student’s t test. b Phase-contrast microscopy images of 344SQ cells transduced with miR-34a, miR-34b/c, or empty vectors. Arrows indicate filopodia formation changes at the leading edge. c Growth of miR-34-transduced 344SQ cells. Cells were seeded on 24-well plates. Cell numbers were counted after the indicated days. Data are expressed as the mean ± SD (n = 4). *P ≤ 0.05, **P ≤ 0.01 compared with vector and #P < 0.05 compared with miR-34a cells; two-tailed Student’s t test. d Soft agar colony formation assay in 344SQ cells transduced with miR-34a (34a), miR-34b/c (34bc), or an empty vector (vec). Cells seeded in soft agar were stained with nitro blue tetrazolium 3 weeks after seeding. Colonies larger than 150 μm in diameter were counted (left graph). Data are expressed as the mean ± SD (n = 9). P-values were determined by two-tailed Student’s t test. e Cell attachment assay in miR-34-transduced 344SQ cells. Attached cells at the bottom of the culture plates were quantified 1, 2, or 3 h after seeding by optical densitometry (595 nm) of the cells stained with crystal violet. Data are expressed as the mean ± SD (n = 4). *P ≤ 0.05, **P ≤ 0.01 compared with the vector and #P ≤ 0.05 compared with miR-34a cells; two-tailed Student’s t test

