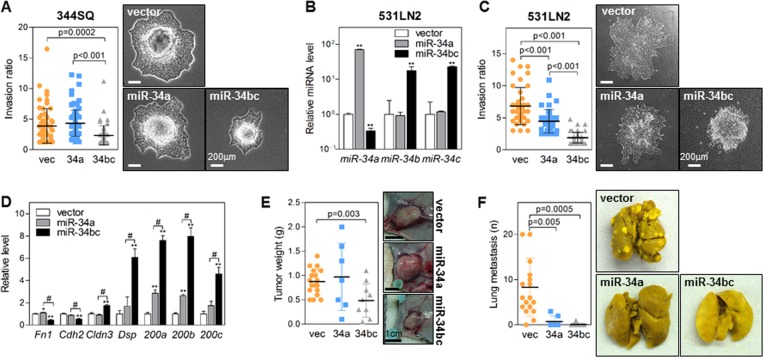
Fig. 4. MiR-34b/c inhibits invasion and EMT more effectively than miR-34a.
a Spheroid invasion assay in miR-34-transduced 344SQ cells. Spheroids were seeded on collagen gels and then cultured for 48 h. Data are expressed as the mean ± SD (vec, n = 67; 34a, n = 96; 34bc, n = 59). P-values were determined using the two-tailed Student’s t test. b qRT-PCR of miR-34 family members in miR-34-transduced 531LN2 cells. Expression levels were normalized to the RNU6B snoRNA level, and the values relative to those of the 531LN2-vector (set at 1.0) are presented. Data are expressed as the mean ± SD (n = 3). **P ≤ 0.01; two-tailed Student’s t test. c Spheroid invasion assay in miR-34-transduced 531LN2 cells. Spheroids were seeded on collagen gels and then cultured for 48 h. Data are expressed as the mean ± SD (vec, n = 41; 34a, n = 41; 34bc, n = 58). P-values were determined using two-tailed Student’s t test. d qRT-PCR of EMT markers (Fn1 and Cdh2: epithelial, Cldn3 and Dsp: mesenchymal markers) and miR-200 family members (miR-200a, miR-200b, and miR-200c) in miR-34-transduced 344SQ cells. Expression levels were normalized to Rpl32 (for mRNA) or RNU6B snoRNA (for miRNA) levels. The values relative to those of the 344SQ vector (set at 1.0) are presented. Data are expressed as the mean ± SD (n = 3). *P ≤ 0.05, **P ≤ 0.01 compared with vector and #P ≤ 0.01 compared with miR-34a cells; two-tailed Student’s t test. e, f Primary tumor weight (e) and number of lung metastases (f) in syngeneic mice (129/Sv) injected subcutaneously with miR-34-transduced 344SQ cells (1 × 10⁶ cells per mouse). Lungs were stained with Bouin’s solution to visualize the metastatic tumor nodules. Data are expressed as the mean ± SD (vec, n = 19; 34a, n = 7; 34bc, n = 10). P-values were determined using two-tailed Student’s t test

