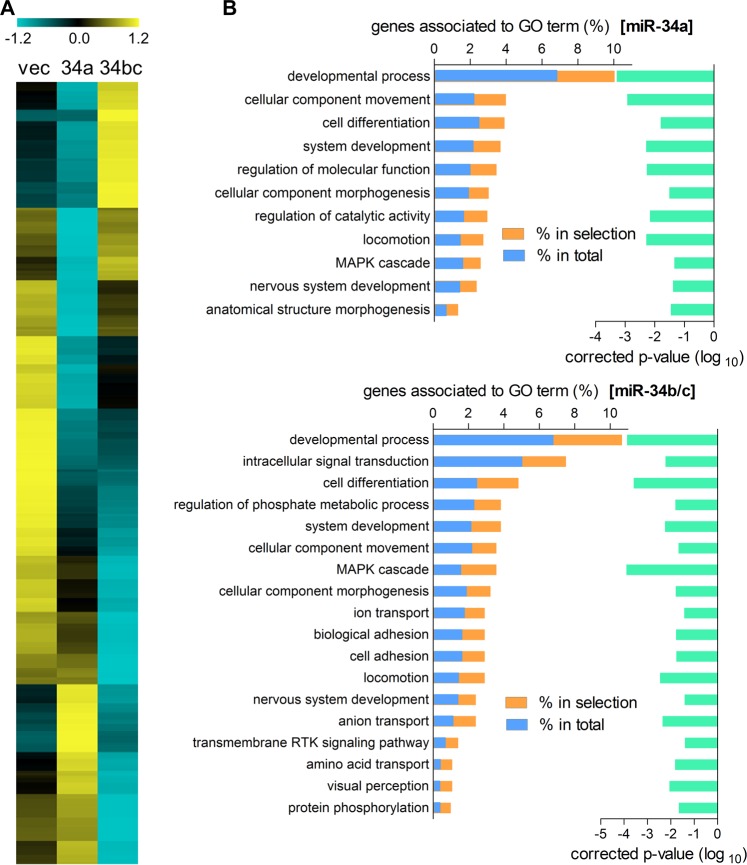
Fig. 5. MiR-34a and miR-34b/c have different effects on target gene expression.
a Heatmap of differentially expressed genes (fold change ≥ 2) in miR-34-transduced 344SQ cells compared with those of vector-transduced cells, as identified by RNA sequencing. Yellow: increased expression; blue: decreased expression. b Gene ontology (GO) enrichment analysis (http://pantherdb.org) of differentially expressed genes in the miR-34- or miR-34b/c-transduced 344SQ cells. Genes associated with the GO terms are shown in the left hand bars for differentially expressed genes (% in selection, orange) and for the total set of 22,262 genes (% in total, blue). The adjusted p-values (false discovery rate, FDR) are represented in the right hand bars (green). The GO terms with fold-enrichment ≥ 1.5 and FDR ≤ 0.05 were selected for the results

