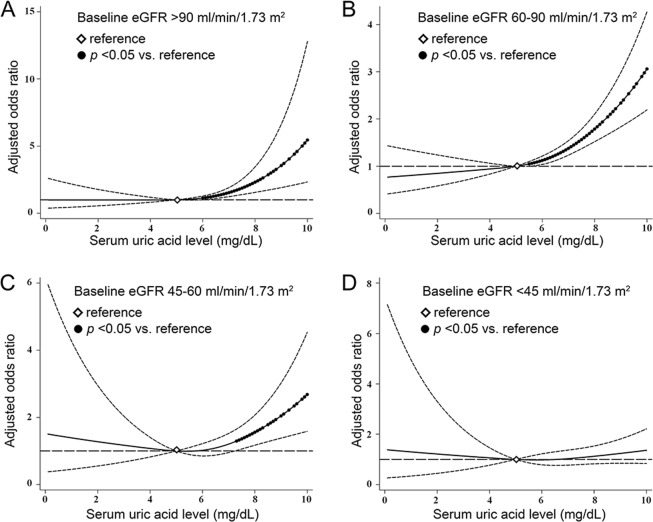
Figure 2.
Cubic spline models for the association of serum uric acid levels with the risks of early renal function decline among strata of baseline eGFR (A) >90 ml/min/1.73 m2, (B) 60–90 ml/min/1.73 m2, (C) 45–60 ml/min/1.73 m2, and (D) <45 ml/min/1.73 m2. Models were adjusted for 20 demographic and clinical variables. Filled circles denote statistical significance (p < 0.05) compared to the reference (diamond) serum uric acid level of 5.0 mg/dL. Solid line (—) denotes adjusted odds ratio and dash line (—) denotes 95% confidence intervals.

