Figure 2.
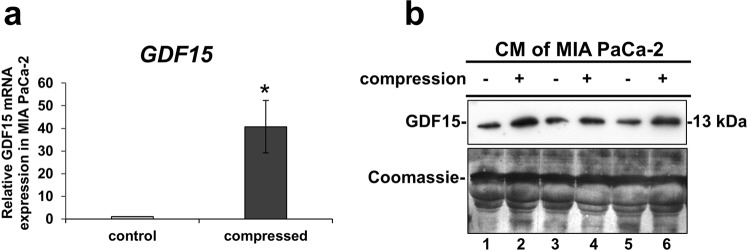
Mechanical Compression stimulates the mRNA expression and secretion of GDF15. (a) MIA PaCa-2 cells were subjected to 4.0 mmHg of compressive stress for 16 hours and the expression of GDF15 was measured by qPCR. The mRNA expression in each sample was quantified by the ΔΔCt method using the expression in uncompressed cells as a reference. Bar graphs represent the mean fold change ± SE of four biological replicates (n = 12). Statistically significant changes between compressed and uncompressed cells are indicated by an asterisk (*) (p < 0.05). (b) Western Blotting showing the secretion of GDF15 in the conditioned medium (concentrated by 40X) of compressed MIA PaCa-2 from three independent experiments. Coomassie staining was used to verify equal protein loading. Full length blot can be found in Supplementary Fig. 6a.

