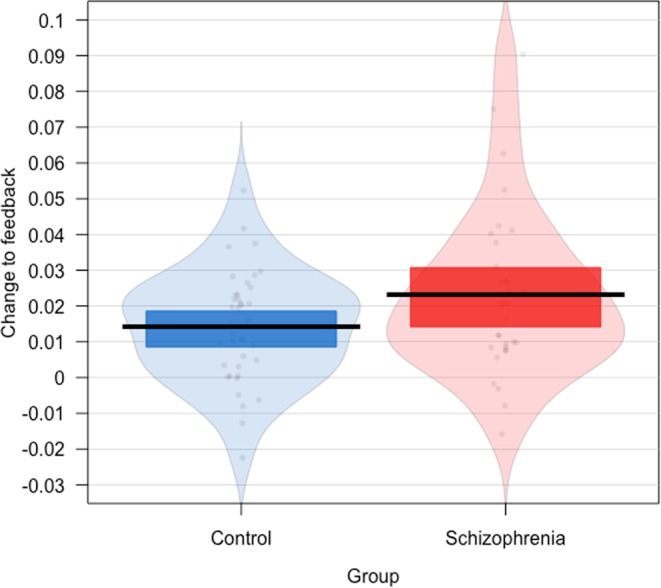
Figure 2.

The effect of feedback on change in trustworthiness ratings in the two groups. Individual dots correspond to estimates for individual participants and were calculated as the participant-level random slope of feedback in a statistical model predicting change from feedback, group and initial ratings. The horizontal line is the mean for each group, the coloured bars indicate 95% Bayesian Credible Intervals of the mean and the background violin shapes, the distribution of the data.
