Fig. 5.
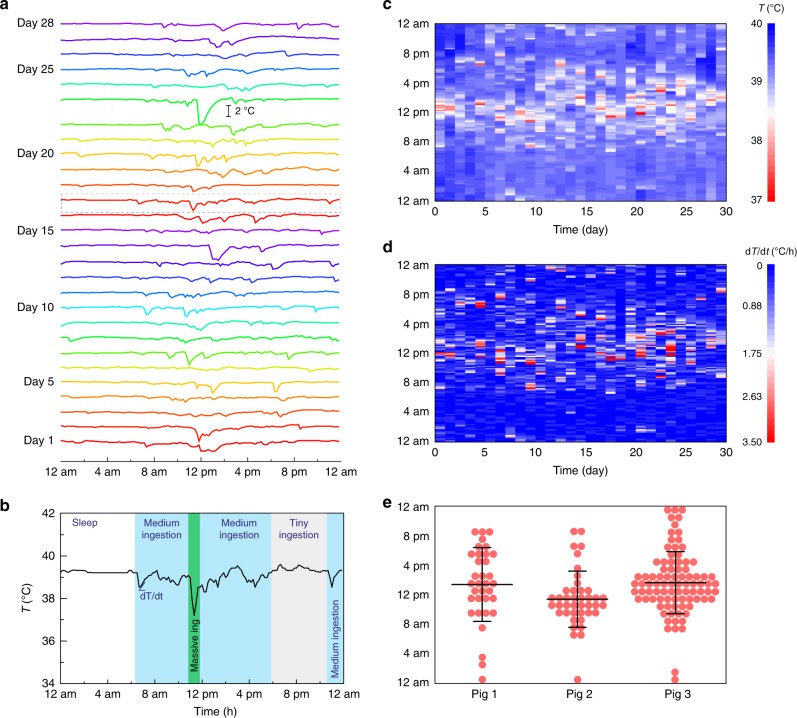
Analysis on the prolonged porcine gastric temperature profile measured. a The long-term measured gastric temperature in Fig. 4f are replotted on a daily basis. b On a single day (day 17), the temperature profile is divided into different phases with different ingestion activities based on the degree of fluctuations. c The heatmap of the temperature (T) measured by hydrogel device over 29 days. d The heatmap of the absolute temperature derivative (|dT/dt|) measured by hydrogel device over 29 days. e The time slots (1 h) with food intake (if any |dT/dt| > 1.75 during the time slot) are marked as events for different pigs. Data represent the mean ± s.d. N = 34 events for pig 1 in 9 days, N = 41 events for pig 2 in 13 days, and N = 88 events for pig 3 in 29 days

