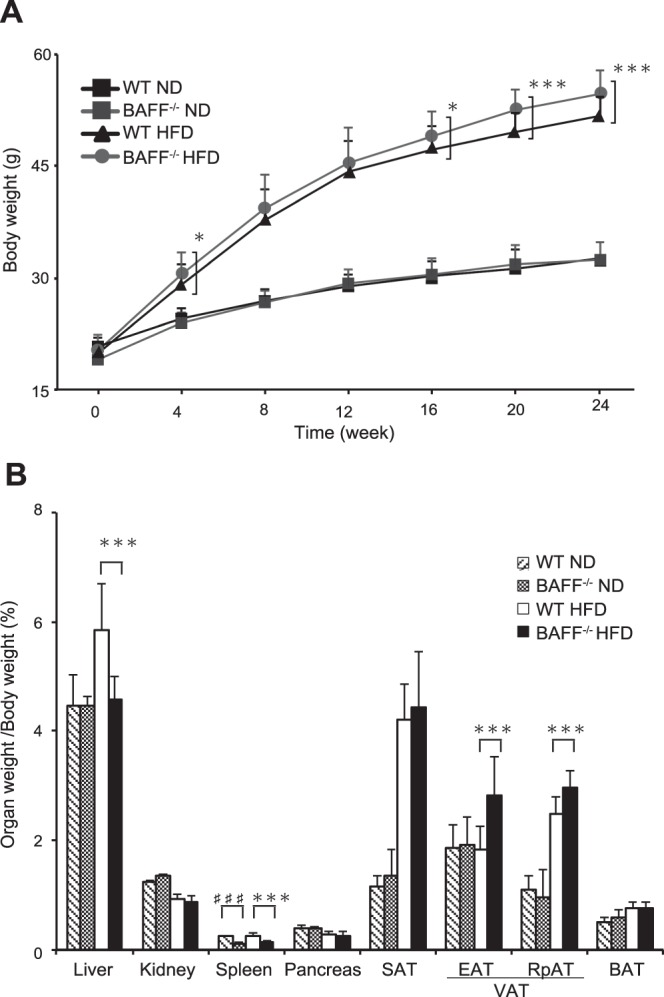
Figure 1.

Lipid distribution in adipose tissue and liver is altered in BAFF−/− mice fed an HFD. (A) Changes in body weight of BAFF−/− and WT mice fed an ND or HFD (n = 25–55/group). (B) Organ weight [(organ weight/body weight) × 100%] in BAFF−/− and WT mice fed an ND (n = 6/group) or HFD (n = 7/group) for 24 weeks. For all bar plots shown, data are expressed as the mean ± SD, and significance was determined by two-tailed Student’s t test (A) and Mann–Whitney U test (B). ♯♯♯P < 0.001 compared to WT-ND mice. *P < 0.05, **P < 0.01, and ***P < 0.001 compared to WT-HFD mice. BAFF, B cell-activating factor; WT, wild-type; ND, normal diet; HFD, high-fat diet; SAT, subcutaneous adipose tissue; EAT, epididymal adipose tissue; RpAT, retroperitoneal adipose tissue; VAT, visceral adipose tissue; BAT, brown adipose tissue.
