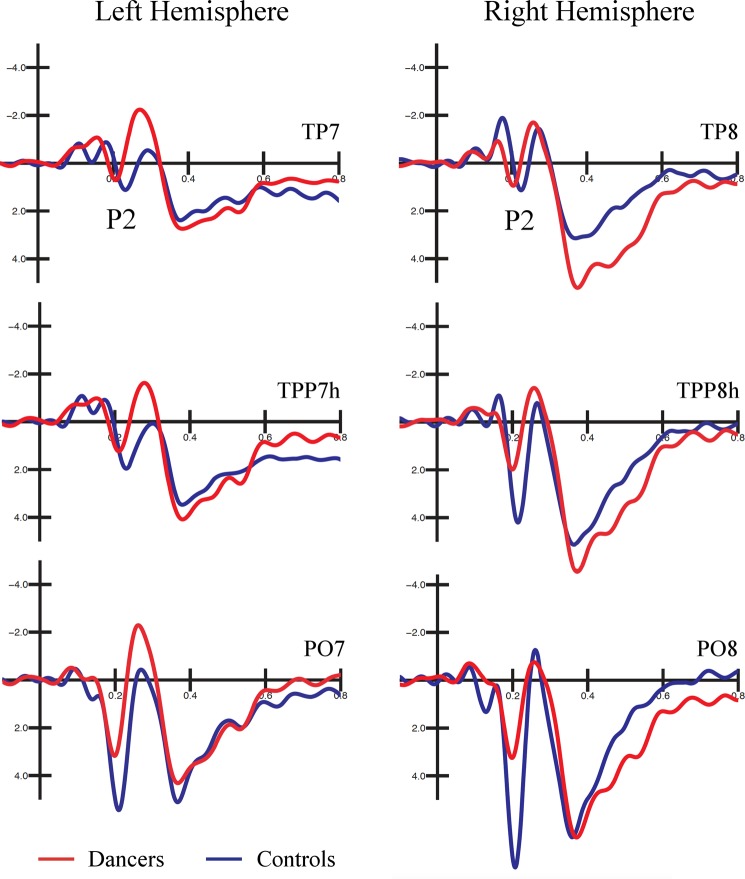
Figure 2.
Grand average waveforms recorded at occipito-temporal and temporo-parietal sites. Grand average waveforms (ERPs) recorded over occipito-temporal and temporo-parietal sites in dancers (in red) and controls (blue). An early P2 response is visible in the dancers than controls at all electrode sites. A between-group difference in the P2 amplitude was also found at PO7-PO8 electrode sites, being larger in the controls than dancers.

