Fig. 1.
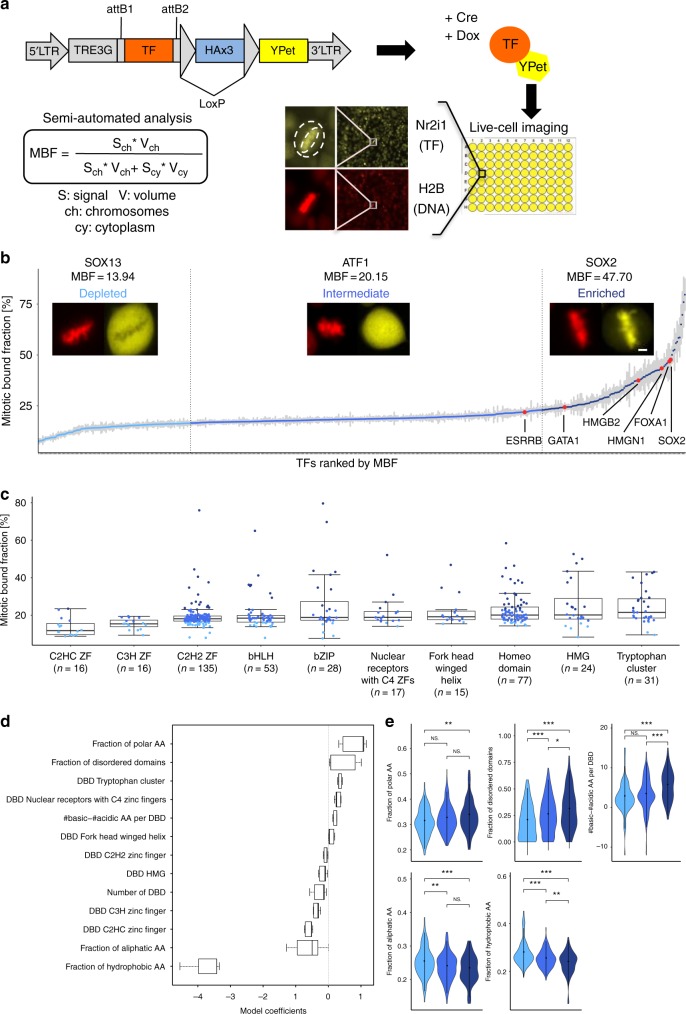
Large scale quantification of mitotic chromosome binding of TFs. a Experimental strategies for generating a lentiviral and ES cell TF-YPet expression library and for quantifying their association to mitotic chromosomes. b Mitotic bound fraction of 501 transcription factors, ranked from lowest to highest and grouped in three bins according to the color code described in the caption (for n values see Supplementary Table 2). Microscopy inset show representative images of TF localization in metaphase for each category. Scale bar: 3 µm. Error bars: SEM. c Mitotic bound fraction of TFs with different types of DNA binding domains. The color code is the same as in panel b. Boxes: intervals between the 25th and 75th percentile and median (horizontal line). Error bars: 1.5-fold the interquartile range or the closest data point when no data point is outside this range. d Parameters recovered by machine learning that impact the MBF and retained in the model for >90% of the runs (n = 500). Boxes: intervals between the 25th and 75th percentile and median (horizontal line). Error bars: 1.5-fold the interquartile range or the closest data point when no data point is outside this range. e Violin plots of TF distributions for the fraction of polar amino acids, fraction of disordered domains, number of basic residues minus the number of acidic residues, dispersion of positive charges, and fraction of hydrophobic amino acids, grouped in the same categories as in panel b (nDepleted = 118, nIntermediate = 272, nEnriched = 111). ∗p-value<0.05; ∗∗p-value<0.01; ∗∗∗p-value<0.001; NS not significant (Wilcoxon rank-sum test). P-values were obtained using a Wilcoxon rank-sum test

