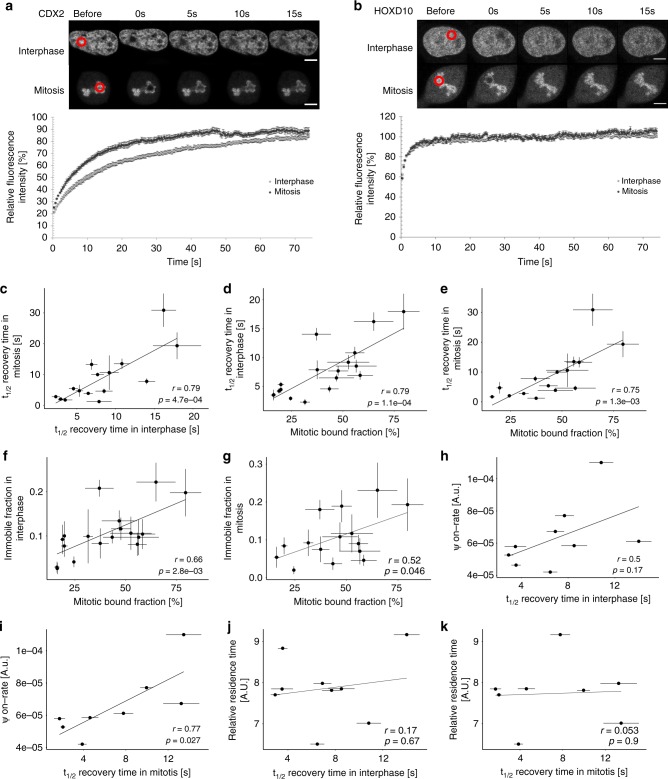
Fig. 3.
TF mobility correlates with the mitotic bound fraction and interphase ψon-rate. a, b Top: Example of FRAP for CDX2-YPet (a) and HOXD10-YPet (b) for cells in interphase and mitosis (scale bar: 5 µm). Bottom: normalized interphase and mitosis FRAP recovery curves for CDX2-YPet (a) and HOXD10-YPet (b). c Correlation between FRAP t1/2 recovery of TFs in interphase and mitosis. d Correlation between TF mitotic bound fraction and FRAP t1/2 recovery in interphase. e Correlation between TF mitotic bound fraction and FRAP t1/2 recovery in mitosis. f Correlation between TF mitotic bound fraction and FRAP immobile fraction in interphase. g Correlation between TF mitotic bound fraction and FRAP immobile fraction in mitosis. h Correlation between FRAP t1/2 recovery in interphase and the ψon-rate. i Correlation between FRAP t1/2 recovery in mitosis and the ψon-rate. j Correlation between FRAP t1/2 recovery in interphase and TF relative residence times. k Correlation between FRAP t1/2 recovery in mitosis and TF relative residence times. Error bars: SEM. r-values (r) and p-values (p) are based on Pearson correlation. For FRAP relative intensity, t1/2 recovery time and immobile fraction: n = 10

